Commercial solar budgets live or die in the spreadsheet long before the first module leaves the pallet. We supply equipment to EPCs and developers every week, and the pattern is always the same: the projects that pencil out are the ones where somebody priced every line item honestly — modules, racking, inverters, wire, labor, permitting, interconnection, and the ugly surprises in between. This guide breaks down real 2025 commercial solar installation costs per watt, shows you where the money actually goes, and gives you the math to model payback before you sign an EPC contract.

We've quoted BOMs for everything from a 40 kW rooftop on a warehouse in Tualatin to a 2 MW ground mount outside Phoenix. The cost drivers are identical at both scales — only the proportions change. What follows is the framework we use internally when a developer sends us a napkin sketch and asks what it should cost — the same math whether you're building your first rooftop or your fiftieth.
A Closer Look at Commercial Solar Costs
Ask three installers what commercial solar costs and you'll get three numbers, because "commercial" spans a 25 kW church roof and a 5 MW utility interconnection. The useful way to talk about cost is dollars per watt (DC), fully installed, before incentives. In 2025, most U.S. commercial projects land between $1.60 and $2.80 per watt installed, with small rooftop systems at the top of that band and large ground mounts at the bottom.
Here's the scaling pattern we see across real quotes:
| System Size (DC) | Typical All-In Cost per Watt | Total Installed Cost Range | Notes from the Field |
|---|---|---|---|
| 25–50 kW (small rooftop) | $2.40–$2.80/W | $60,000–$140,000 | Fixed costs (design, permits, mobilization) spread over few watts |
| 100–250 kW (mid rooftop) | $2.00–$2.40/W | $200,000–$600,000 | The sweet spot for warehouses, schools, retail |
| 500 kW–1 MW | $1.75–$2.10/W | $875,000–$2,100,000 | Bulk purchasing kicks in; string inverters dominate |
| 1–5 MW ground mount | $1.40–$1.85/W | $1.4M–$9.25M | Piling, trenching, and interconnection become the swing items |
| 5 MW+ utility scale | $1.00–$1.40/W | $5M+ | Developer territory — EPC margins thin, equipment leverage huge |
Compare that to residential, which still runs $2.75–$3.50/W for a typical rooftop. Commercial wins on scale, but it pays that back in engineering, permitting, and interconnection complexity that a residential job never touches.
Site Assessment: The Costs Before the Costs
Before a single watt gets priced, somebody pays for due diligence. On our side of the counter we watch developers skip this step to save $15,000 and then eat $150,000 in change orders. The disciplined sequence looks like this:
| Due-Diligence Item | Typical Cost | What It Prevents |
|---|---|---|
| Structural roof assessment (PE letter) | $2,500–$7,500 | Discovering mid-install that the deck can't carry ballast loads |
| Roof condition report / core samples | $1,500–$4,000 | Mounting a 25-year asset on a roof with 6 years of life |
| Electrical service survey | $1,000–$3,500 | NEC 705.12 busbar surprises at the main switchgear |
| Geotechnical report (ground mount) | $8,000–$25,000 | Refusal, rock, or corrosive soils destroying the pile budget |
| ALTA survey & environmental screen | $5,000–$15,000 | Easements, wetlands, and setback violations post-design |
| Utility pre-application / feasibility review | $500–$5,000 | Designing 1 MW for a circuit that can host 400 kW |
Call it $25,000–$60,000 of pre-development spend on a mid-size project. I tell every developer the same thing: that money is not overhead, it's the cheapest risk reduction in the entire pro forma. A $4,000 geotech report that moves your pile spec from 8-foot driven posts to 12-foot screws before you sign the EPC contract just saved you a six-figure change order.
Critical Cost Breakdown for Commercial Solar Projects
Every commercial proposal we review decomposes into roughly the same buckets. Memorize these percentages and you can sanity-check any EPC quote in about ninety seconds:
| Cost Component | Description & Key Considerations | Estimated Percentage of Total Cost |
|---|---|---|
| Solar Modules | The PV panels themselves; Tier 1 pricing fluctuates with polysilicon and tariffs | 15–25% |
| Inverters | String, central, or microinverters; converts DC to usable AC power | 5–12% |
| Racking & Mounting | Ballasted rooftop, attached rooftop, or ground-mount structures and piles | 8–15% |
| Electrical BOS | Wire, conduit, combiners, disconnects, switchgear, transformers | 8–12% |
| Labor & Installation | Mechanical and electrical crews; prevailing wage jobs run 20–40% higher | 10–20% |
| Permitting & Engineering | Structural and electrical stamps, AHJ fees, utility studies | 3–8% |
| Overhead, Margin & Contingency | EPC profit, insurance, warranty reserve, change-order buffer | 10–18% |
If a quote comes in with modules at 40% of total cost, somebody is either overpaying for panels or underpricing labor — and both of those problems surface later, usually during inspection.
Riding the Waves of Market Changes
Module pricing in 2025 sits near historic lows — we've moved Tier 1 TOPCon modules under $0.30/W at pallet quantities, a number that would've been fantasy three years ago. But tariff exposure (AD/CVD on Southeast Asian imports), transformer lead times still stretching 12–24 months for pad-mounts, and copper prices keep the total installed number from falling as fast as the module line item. Budget with a 5–10% contingency on any project quoting more than 90 days out from procurement.
On the equipment side specifically, the biggest 2025 shift is the dominance of n-type TOPCon cells across Tier 1 lineups — the P-type PERC module that anchored commercial BOMs for a decade is being phased out of premium product lines. For a buyer this is mostly good news: you're getting 1–2% more nameplate efficiency and better bifacial gain at the same dollar per watt. The caution is supply-chain freshness — newer cell lines mean less field history, which is one more argument for sticking with manufacturers whose warranty you can actually collect on. Bifacial makes sense on white membrane roofs and ground mounts with high albedo; on a dark composition shingle or a low-tilt ballasted roof, the rear-side gain is rounding error and you're paying for glass-glass weight you don't need.
Analyzing Your Hardware and Equipment Costs
Hardware is the part of the budget you can actually negotiate, and it's where working with a wholesale distributor instead of buying through your EPC's markup chain pays for itself.
The Core Components and Their Costs
Current wholesale ranges we see moving through our warehouse:
| Component | Wholesale Price Range | Spec That Drives the Price |
|---|---|---|
| Tier 1 mono/TOPCon module (550–600W class) | $0.22–$0.35/W | Efficiency, cell type (TOPCon/HJT premium), pallet quantity |
| String inverter (50–125 kW) | $0.06–$0.12/W | Number of MPPTs, 1500V vs 1000V architecture |
| Microinverter (per module) | $0.25–$0.40/W | Usually too expensive above ~100 kW; fine for small commercial |
| Ballasted rooftop racking | $0.10–$0.18/W | Roof load limits, wind zone, tilt angle |
| Ground-mount fixed tilt (incl. piles) | $0.15–$0.30/W | Soil conditions — refuse to quote without a geotech report |
| PV wire + copper feeders | $0.05–$0.12/W | Copper vs aluminum feeders; voltage drop distance |
Strategic Procurement: Tier 1 vs. Tier 2 Modules
Tier 1 is a bankability label, not a quality certification — it measures the manufacturer's financials, not the module. That said, on financed projects the lender usually dictates the approved vendor list, so the choice is often made for you. Our advice after watching a few manufacturers go sideways: pay the extra $0.02–0.04/W for a Tier 1 nameplate on anything over 250 kW with third-party money. On cash deals, a solid Tier 2 module with a real U.S. warranty presence can be the better value. Browse current availability across commercial solar panels and commercial inverters to benchmark live pricing before your next bid.
Optimizing Your Supply Chain
Procurement timing is a cost line even if it never appears on one. Modules ordered 120 days ahead of mobilization at a locked price routinely save 8–12% versus spot-buying during construction. We hold pallet inventory for repeat EPC customers for exactly this reason — a container price locked in March is protection against a June tariff headline. Check our panel pallet bundles for volume pricing, and if you're buying at project scale, open a Pro Account or request a project quote so the numbers reflect actual volume tiers.
Choosing an Inverter Architecture for Commercial Projects

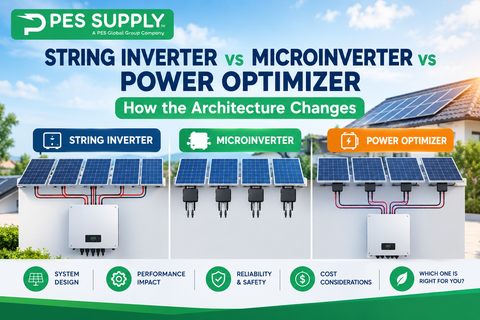
Inverter selection moves 5–12% of the budget and nearly 100% of the long-term service experience. The three architectures behave very differently at commercial scale:
| Architecture | Cost per Watt | Best Fit | Trade-Offs |
|---|---|---|---|
| String inverters (50–125 kW units) | $0.06–$0.12/W | Most rooftops and ground mounts up to ~5 MW | Distributed failure points, easy truck-roll service, granular MPPT |
| Central inverters (1–4 MW blocks) | $0.04–$0.08/W | Utility-scale, 5 MW and up | Cheapest per watt, but one failure takes a whole block offline |
| Microinverters / optimizers | $0.25–$0.40/W | Small commercial under ~100 kW, shaded or complex roofs | Module-level monitoring and shade tolerance at a steep premium |
We've supported jobs on all three. Above about 250 kW, string inverters win on economics almost every time — a failed 100 kW string unit costs you one string's production and a forklift swap, while a central inverter failure is an emergency. Microinverters on a 500 kW flat roof are how you turn a $1.9 million project into a $2.2 million project for monitoring granularity the facilities manager will check twice a year. Match the architecture to the maintenance staff you actually have, not the dashboard demo you liked at the trade show. Our solar inverter buyer's guide and inverter sizing calculator go deeper on the selection math.
Interconnection: Timelines and Study Costs
Interconnection is the schedule killer nobody budgets for honestly. Queue position, study costs, and upgrade exposure vary wildly by utility territory:
| Project Scale | Typical Study Path | Study & Fee Range | Realistic Timeline |
|---|---|---|---|
| Under 100 kW | Fast-track / simplified review | $500–$5,000 | 2–6 months |
| 100 kW–1 MW | Full interconnection study | $10,000–$75,000 | 6–18 months |
| 1–5 MW | System impact + facilities study | $75,000–$300,000 | 12–30 months |
| 5 MW+ | Transmission-level queue (CAISO, PJM, etc.) | $250,000+ | 3–7 years in congested queues |
The practical play on distribution-level projects is to right-size the export to what the circuit can host. Export-limiting a 750 kW array to 500 kW through the inverter's power control can shrink a $200,000 upgrade scope to a paperwork exercise. Your developer should be modeling this before design freeze, not after the utility study comes back ugly.
Labor Rates and Regional Cost Variation
Labor is the second-largest line item and the most region-dependent. Prevailing-wage jurisdictions, union requirements, and simple cost-of-living differences swing the number hard:
| Region | Typical Install Labor ($/W) | Context |
|---|---|---|
| Southeast (TX, FL, GA) | $0.30–$0.50/W | Deep labor pools, competitive EPC market |
| Midwest | $0.35–$0.55/W | Seasonal schedule compression raises effective rates |
| West (CA, AZ, NV) | $0.45–$0.75/W | California prevailing wage pushes the top of the range |
| Northeast | $0.50–$0.85/W | Union requirements common on public work; high AHJ overhead |
| Pacific Northwest | $0.40–$0.65/W | Moderate rates, but rain-shortened production days |
When you compare EPC bids across regions, normalize for labor before you judge anyone's efficiency. A Phoenix crew and a Boston crew are not playing the same sport.
Navigating Soft Costs Like Permitting and Labor
Soft costs are where commercial budgets blow up. Hardware is a catalog; soft costs are a negotiation with a city, a utility, and a workforce.
The Critical Role of Labor in Your Budget
Plan on $0.35–$0.60/W for installation labor on rooftop work, sometimes less on open-field ground mounts where production rates climb. Prevailing-wage requirements on public projects (schools, municipal buildings) push that to $0.60–$0.90/W and also buy you the most experienced crews — we've rarely seen a prevailing-wage job fail inspection on workmanship. The labor killer is rework: a missed structural attachment detail that means re-flashing 200 roof penetrations will erase your margin in a week.
Crew composition matters as much as crew cost. A commercial crew should be led by a licensed electrician with PV-specific experience, backed by installers who've done at least two projects on the same racking system yours uses. Ask the EPC who's actually showing up — the A-team that built the reference project in their proposal, or a subcontracted crew assembled the week before mobilization. The labor rate is negotiable; the experience behind it isn't.
A Developer's Guide to Permitting and Interconnection
Permitting runs $0.03–$0.10/W depending on the AHJ, but interconnection is the real wild card. A simple load-side tap on an existing 480V service might cost $15,000 in utility fees. A dedicated feeder and a new pad-mount transformer on a constrained circuit can run $250,000+ and take 18 months. Submit the interconnection application the day you have site control — not after design. Our NEC code compliance guide covers the code articles (690, 705, 240) that shape your one-line, and the solar installation guide walks the full sequence from layout to final inspection.
Hidden Costs: Common Budget Breakers to Watch For
| Hidden Cost | Why It Happens | How to Prepare |
|---|---|---|
| Roof replacement before install | Membrane has <15 years of life left; reroofing under an array costs 3× more later | Get a roofing contractor's letter during due diligence; budget $4–8/sq ft if needed |
| Main service panel / switchgear upgrade | NEC 705.12 busbar limits block the interconnection tap | Inspect the service gear on the first site walk; price the upgrade into the pro forma |
| Utility interconnection upgrades | Circuit capacity, transformer loading, protection requirements | Apply early; negotiate scope; consider export-limiting to shrink the study scope |
| Structural reinforcement | Older buildings can't take 4–6 psf of ballasted array | Structural engineer letter before you price racking |
How Project Scale and Technology Reduce Costs

Rooftop vs. Ground Mount: The Real Cost Delta
Developers ask us constantly which configuration to pursue on a site that could take either. The answer depends on land value, soil, and roof condition, but the equipment and labor deltas are consistent:
| Factor | Ballasted Rooftop | Ground Mount (Fixed Tilt) |
|---|---|---|
| Racking cost | $0.10–$0.18/W | $0.15–$0.30/W including piles |
| Site prep | Minimal (roof condition dependent) | Clearing, grading, access roads: $0.05–$0.20/W |
| Labor productivity | Lower (crane lifts, roof logistics, fall protection) | Higher (ground-level production work) |
| Electrical runs | Short DC runs, tap at existing service | Long trench runs, dedicated transformer common |
| Permitting complexity | Building + electrical | Building + electrical + land use, sometimes environmental |
| Production per kW | Constrained by roof azimuth/tilt | Optimal orientation, better soiling access |
Net-net: rooftop usually wins on total cost per watt when the roof is sound and the service has capacity, because you're piggybacking on existing structure and switchgear. Ground mount wins on production per watt and O&M access, and it's the only option once you outgrow the roof. Plenty of our customers do both — rooftop on the warehouse, canopy over the parking lot, and the ground mount sized to whatever the interconnection will actually allow.
How to Read an EPC Bid Without Getting Fooled
Three bids come in: $2.05/W, $2.20/W, and $2.35/W. The cheap one is rarely cheap. Normalize them before you compare — line up what's included in each number. We regularly see low bids that exclude the interconnection upgrade allowance, the monitoring hardware, the prevailing-wage labor rider, or the roof warranty rider required to keep the membrane warranty intact. Those exclusions surface later as change orders, and change orders always price at retail-plus.
Ask every bidder the same five questions: Does this number include utility upgrade allowances, and what's the cap? What module and inverter SKUs are quoted, and are they locked or subject to substitution? What's the assumed labor basis — prevailing wage or open shop? Who carries the schedule risk if interconnection slips? And what's excluded, in writing? A bid that answers all five cleanly at $2.35/W beats a vague $2.05/W every single time. The expensive lesson I've watched multiple owners learn is that EPC selection is risk allocation dressed up as price comparison.
The Power of Economies of Scale
Doubling system size does not double cost — it raises it maybe 60–75%. Design, permitting, mobilization, and interconnection are close to fixed, so every additional watt dilutes them. This is why a 500 kW quote at $1.90/W and a 100 kW quote at $2.40/W can both be fair prices from the same installer.
Using Advanced Technology to Lower Costs
Bigger modules (600W+ class) cut racking attachments, wire runs, and labor-hours per watt. Higher-power string inverters shrink the inverter count and the AC combiner bill. On flat roofs, 10° ballasted racking with tight row spacing usually beats 20° tilt on total kWh per roof square, even at slightly lower per-module yield — the layout math matters more than the spec-sheet efficiency. Don't chase the last 0.5% of module efficiency; chase watts per square foot of usable roof.
Maximizing Your ROI with Incentives and Financing
Unlocking Federal and State Incentives
The federal Investment Tax Credit remains the anchor: 30% of installed cost as a direct credit against tax liability, with adders (domestic content, energy community) that can stack to 40–50% on qualifying sites. On top of that, MACRS 5-year accelerated depreciation with bonus depreciation lets a profitable business recover another 20–30% of project cost through tax shields. Add state programs — our solar incentives by state page tracks them — and net effective cost often lands at 40–55 cents on the dollar for a tax-motivated owner.
Two incentive mechanics deserve attention in 2025 planning. First, the domestic content adder (+10% ITC) is increasingly realistic now that U.S. module assembly capacity has scaled — if your project qualifies, spec the domestic BOM early because retrofits of the procurement plan cost more than the premium. Second, energy-community siting (+10% ITC) covers brownfields and former fossil-fuel communities; we've seen projects restructure site selection around it because 10 points of ITC on a $5 million project is $500,000. Both adders require documentation discipline from day one — this is not paperwork you reconstruct at filing time.
Choosing the Right Financing Model
Who owns the system determines who captures the ITC and depreciation, and that's usually worth more than the interest rate difference between options:
C-PACE deserves a special mention for owner-occupied buildings: it finances through a property tax assessment, which means 20–30 year terms, transferability on sale, and no personal guarantee. Where it's available, it solves the two classic objections — "we might sell the building" and "we don't want debt on the balance sheet" — in one instrument. The trade-off is lender consent requirements from your mortgage holder, which can take 60–90 days of negotiation.
| Financing Model | Who Owns The System? | Typical Upfront Cost | Key Benefit |
|---|---|---|---|
| Cash Purchase | You | 100% of project cost | Highest lifetime ROI; captures ITC + MACRS directly; payback typically 4–7 years |
| Solar Loan | You | 0–20% down | Ownership benefits with preserved capital; C-PACE in many states attaches to the property tax bill |
| Power Purchase Agreement (PPA) | Third-party developer | $0 | Buy power at a fixed discount to utility rates; no tax appetite needed |
| Operating Lease | Lessor | $0 to low | Off-balance-sheet; predictable monthly expense; less common since the ITC era than PPAs |
If the host business has tax appetite, ownership wins almost every time. If it's a nonprofit, school, or municipality, the PPA exists precisely to monetize credits they can't use.
Calculating Your Long-Term Payback and ROI

Understanding Ongoing Operations and Maintenance Costs
Commercial O&M runs $10–20 per kW per year: monitoring, two inspections, module washing where soiling matters, inverter service reserves. String inverters will need attention around year 10–12; budget a replacement reserve. We've seen owners skip the $3,000/year monitoring plan and lose $12,000 in production to a failed string nobody noticed for four months. Monitoring is the cheapest insurance in the budget.
One more field note on O&M: put vegetation management in writing on ground mounts. A single summer of unchecked growth under a low-clearance array can shade the bottom row of modules 6–8% and turn your production guarantee into a lawsuit. The sites that hold their modeled numbers are the ones with a $0.002/W/year line item for a mowing contract and thermographic scans every other year — a drone IR pass finds failed bypass diodes and hot spots while they're still a warranty claim instead of a fire.
Calculating Your Simple Payback Period
Simple payback is net cost divided by annual savings, but three assumptions decide whether the number is honest. First, rate escalation: 2–3% annual utility escalation is defensible from historical data; anything above 4% is salesmanship. Second, degradation: 0.4–0.55% per year for modern n-type modules, applied to production, not savings. Third, the discount rate for anything beyond simple payback — if your CFO lives in NPV-land, use the company's actual weighted average cost of capital, not a number from the installer's brochure. Get those three right and even a simple spreadsheet model will land within 10% of the fanciest software output.
A worked example, the way we run it on the whiteboard:
| Line Item | Value | Notes |
|---|---|---|
| System size | 250 kW DC | Warehouse rooftop, Portland, OR |
| Gross installed cost @ $2.10/W | $525,000 | Full EPC contract price |
| 30% Federal ITC | −$157,500 | Credit against tax liability |
| MACRS year-1 tax shield (approx.) | −$95,000 | Varies with tax rate; use your CPA's number |
| Net effective cost | $272,500 | |
| Annual production | 325,000 kWh | 1,300 kWh/kW, typical Pacific Northwest |
| Annual savings @ $0.11/kWh | $35,750 | Blended commercial rate, before escalation |
| Simple payback | 7.6 years | Before rate escalation; ~5.5–6 years with 3% annual utility escalation |
| 25-year net savings (undiscounted) | $600,000+ | Even at conservative assumptions |
Run your own numbers with the solar ROI calculator and the solar system calculator before your next stakeholder meeting.
Factoring in a Transformed Cost Landscape
The honest framing for a CFO: at current module prices and a 30% ITC, the equipment is cheap and the risk sits in soft costs and interconnection timelines. Lock equipment pricing early, file interconnection immediately, and treat the utility study — not the module quote — as your critical path.
A Real Project Anatomy: 480 kW on a Cold-Storage Warehouse
Abstract percentages only go so far, so here's a real project shape (numbers rounded, equipment anonymized) from a cold-storage facility we supplied equipment for last year in the Willamette Valley. The building: 68,000 square feet of usable roof, a 480V/2000A service, and a refrigeration load that never sleeps — which made it a beautiful solar host, because every kilowatt-hour produced was consumed on site at retail offset rather than exported at wholesale rates.
| Budget Line | Amount | Per Watt | Notes |
|---|---|---|---|
| Modules (1,090 × 440W TOPCon) | $115,000 | $0.24 | Locked 5 months ahead, full container |
| String inverters (4 × 125 kW) | $38,000 | $0.08 | 1500V architecture, 12 MPPTs each |
| Ballasted racking | $67,000 | $0.14 | 10° tilt, wind zone C engineering |
| Electrical BOS (wire, combiners, disconnects) | $52,000 | $0.11 | Aluminum feeders to keep copper exposure down |
| Labor (mechanical + electrical) | $168,000 | $0.35 | Open shop, 11-week build |
| Engineering, permits, utility fees | $41,000 | $0.09 | Load-side tap, no service upgrade needed |
| EPC overhead, margin, contingency | $86,000 | $0.18 | Including 5% contingency |
| Total | $567,000 | $1.18/W equipment + soft costs; $1.61/W all-in | Gross, before ITC |
After the 30% ITC and first-year MACRS shield, the owner's net exposure was roughly $290,000 against about $74,000/year in avoided energy cost — a sub-4-year payback made possible by the around-the-clock refrigeration load absorbing 98% of production. The lesson buried in that table: the project penciled because of load match, not because anyone found magic-cheap equipment. Know your interval data before you know your module SKU.
Understanding Your Utility Bill: Energy vs. Demand Charges
Commercial savings math is not residential math. Your bill has two parts: energy charges (per kWh consumed) and demand charges (per kW of peak draw). Solar hammers the energy charge but only dents demand charges when your peak happens in sunlit hours. A manufacturer running a 24/7 process with a 2 AM peak gets far less demand relief than a school peaking at 1 PM on a sunny day. Pull 12 months of interval data from the utility before you model savings — the kWh-only shortcut overstates value for night-peaking loads and understates it for day-peakers. This single step separates realistic pro formas from sales brochures.
Module Procurement Pitfalls That Cost Real Money
Three mistakes we see repeat across procurement cycles. First, buying the last of a discontinued product line to save $0.02/W — then a hail claim in year six can't be matched and you're re-papering a whole section of the array. Second, ignoring packaging format: modules arriving in mixed pallets with broken banding cost you receiving hours and damage claims that eat the discount. Third, missing the delivery window — a container that lands two weeks after your roof mobilization sits in a laydown yard at $1,500/week while your crew waits. Wholesale pricing means nothing without logistics discipline, which is why we quote delivered-to-site with freight coordination on project orders rather than letting a cheap ex-works number turn expensive in the field.
When you're ready to price equipment against your EPC's BOM, send it through our quote desk. Line-item wholesale quotes against a named BOM are free, and they keep your installer honest — even when you buy from them anyway.
Procurement Outlook: What to Watch for the Rest of 2025 and Into 2026
Three forces will move commercial solar costs over the next 18 months. Tariff policy on imported cells and modules remains the biggest wildcard — the AD/CVD cases covering Southeast Asian manufacturers have already pushed some supply toward U.S. assembly with imported cells, which adds $0.03–0.06/W but buys tariff insulation and domestic-content adder eligibility. Transformer and switchgear lead times are the second constraint; on projects requiring new service equipment, the gear — not the panels — sets the schedule, so order long-lead electrical the week you have a signed contract. Third, labor: electrician shortages in high-growth markets aren't improving, and the contractors with stable crews are booking 2–3 quarters out. The practical translation for a 2026 COD target: lock module pricing now, release switchgear at contract, and pick your EPC on crew stability rather than the last nickel per watt. The PowerLink Network exists partly for this — vetted installer capacity matters as much as equipment price when the market gets tight.
Factoring Storage and EV Charging Into the Project
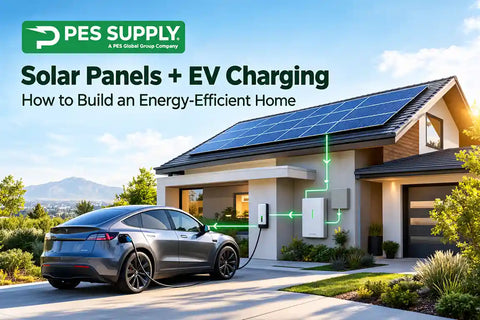
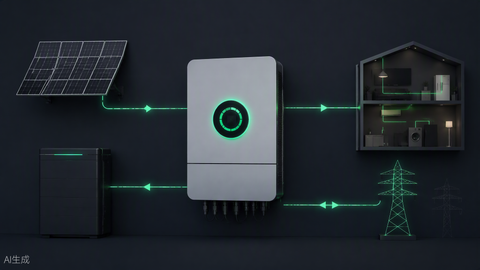
More commercial solar projects now arrive at our quote desk as electrification packages: PV on the roof, batteries in the electrical room, and fleet or employee EV charging in the lot. Designing them together saves real money. The service upgrade you're doing for solar can be sized once for the chargers; the battery that clips your demand peak also buffers charger load so you don't buy a bigger service than you need. We've watched projects pay for a second mobilization and a second switchgear replacement because somebody treated chargers as an afterthought — scope the whole electrification picture at the first design meeting, even if you phase the build over three years. Our guide to EV charging station installation costs pairs well with this one when you're scoping that side of the project.
Got Questions? We've Got Answers
What's a Good Payback Period for a Commercial System?
Under 8 years simple payback is healthy in most markets; 4–6 years in high-rate states (California, Northeast) or with stacked incentives. Anything modeling under 4 years deserves skepticism — check the rate-escalation assumption first.
What Happens If My Installer or the Equipment Manufacturer Goes Out of Business?
Module warranties are only as good as the company behind them, which is the practical argument for Tier 1 bankability on financed projects. Insist on a third-party O&M agreement and escrowed monitoring credentials so any qualified contractor can service the system.
Does My Roof Need to Be New to Install Solar?
It needs 15+ years of remaining life, minimum. Ballasted arrays at 4–6 psf also require a structural letter. If the roof is marginal, reroof first and roll it into the project — it's almost always cheaper than removal and re-install.
How Long Does a Commercial Solar Project Take From Contract to Permission to Operate?
For a 250 kW–1 MW rooftop with a clean interconnection path, plan 9–14 months: 2–3 months of design and permitting, 4–8 weeks of construction, and the balance is utility review and inspection scheduling. Ground mounts and anything requiring a full impact study run longer. The construction phase is the shortest part of nearly every project we've supplied.
Should I Add Battery Storage to a Commercial Solar Project Now or Later?
If demand charges exceed about $15–20/kW on your tariff, storage pencils today in many markets, and it's significantly cheaper to rough in the electrical infrastructure during the solar build than to retrofit. Even if batteries wait, have your engineer leave breaker space and conduit pathways in the design — future-you will be grateful. Our battery sizing calculator is a fast first pass on storage economics.