Updated September 2026 — refreshed against the live PES catalog; product pricing verified 2026-09-26.
2026 product line update
| Product | Class | Price |
|---|---|---|
| Canadian Solar 710W TOPCon Bifacial Solar Panel | 710W | $340.80 |
| Hyundai 640W 156-Cell TOPCon Bifacial Solar Panel | 640W | $220.78 |
| Thornova Solar TS-BGT72(600) 600W Bifacial Solar Panel | 600W | $165.76 |
| Thornova Solar 595W Solar Panel 144 Cell Bifacial TS-BGT72(595) Wholesale 31 panels per pallet | 595W | $164.64 |
| ZNShine Solar 585W 144-Cell Bifacial Solar Panel | 585W | $246.99 |
| Hyundai HiS-S585OJ 585W Clear on Transparent156 Half-Cell Bifacial Solar Panel | 585W | $195.86 |
Live prices verified 2026-09-26. The current pallet line tops out at 550–640W, plus the Canadian Solar 710W TOPCon flagship panel.
Solar panel pricing is one of the most confused numbers in home improvement. A neighbor pays $19,000, a coworker pays $34,000 for a smaller roof, and a door-knocker quotes $2.10 a watt while a website says $3.50. They're often all telling a version of the truth — just about different scopes, different markets, and different years. I've quoted, installed, and serviced residential systems through the cheapest module prices in history and through supply shocks, and the pattern never changes: the people who understand the cost stack get fair deals, and the people who shop on a single number get taken. Here's what home solar actually costs, where the money goes, what changed in 2025 and 2026, and how to read any quote with confidence.

The Headline Numbers: Cost Per Watt, 2025 Edition
The industry prices residential solar in dollars per watt ($/W) of DC nameplate capacity, measured before incentives. Through 2025, the national average for a turnkey residential system held near $2.75 to $3.50 per watt depending on market, with the Sun Belt's competitive metros at the low end and the Northeast and high-cost coastal markets at the top. That spread is real and mostly reflects labor, permitting burden, and sales overhead rather than equipment differences.
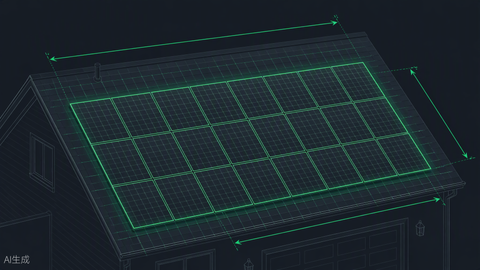
| System size | Gross cost @ $2.75/W | Gross cost @ $3.50/W | Panels needed (440W class) | Roof area required |
|---|---|---|---|---|
| 6 kW | $16,500 | $21,000 | 14 | ~280 sq ft |
| 8 kW | $22,000 | $28,000 | 18–19 | ~380 sq ft |
| 10 kW | $27,500 | $35,000 | 23 | ~470 sq ft |
| 12 kW | $33,000 | $42,000 | 27–28 | ~560 sq ft |
| 15 kW | $41,250 | $52,500 | 34 | ~700 sq ft |
The average American home uses about 10,500 kWh a year, which in most of the country means an 8 to 11 kW system — so the honest "what does solar cost" answer for a typical house is $24,000 to $36,000 before incentives. Anyone quoting dramatically below that range is either in a genuinely cheap market, skipping scope (panel upgrades, main service work, trenching), or planning to make it up in change orders.
Context helps those numbers land. A decade ago the same residential quotes averaged above $4.50 per watt with far less efficient panels; module efficiency gains alone — from 15 percent panels to today's 21–22 percent mainstream — mean fewer panels, fewer rails, and fewer labor hours per kilowatt than any time in history. The counterweight is that labor, permitting, and customer acquisition have deflated far more slowly than hardware, which is why total installed prices plateaued while module prices collapsed. Expect that divergence to persist: the equipment aisle will keep getting cheaper, and the gap between a well-run install and a bloated one will keep deciding what you actually pay.
Where the Money Actually Goes
Modules get all the attention, but they're the minority of a residential quote. NREL's annual cost benchmarks break a typical residential install down roughly like this:
| Cost category | Share of a $3.00/W system | On a $30,000 system | What's in it |
|---|---|---|---|
| Modules (panels) | ~12–15% | $3,600–$4,500 | The panels themselves |
| Inverter(s) | ~8–10% | $2,400–$3,000 | String, micros, or hybrid |
| Racking and BOS hardware | ~8–10% | $2,400–$3,000 | Rails, flashing, wire, disconnects, rapid shutdown |
| Electrical labor | ~10–15% | $3,000–$4,500 | Licensed crew time on the roof and at the panel |
| Permitting, inspection, interconnection | ~5–8% | $1,500–$2,400 | AHJ fees, engineering letters, utility process |
| Sales, overhead, and installer margin | ~35–45% | $10,500–$13,500 | Acquisition, design, warranty reserves, profit |
That last row is why two quotes for identical equipment can differ by $8,000: the difference is almost never the hardware. It's how the installer sells (door-to-door acquisition is brutally expensive and lands in your price), how they staff, and how much margin the market tolerates. This is also why buying equipment directly and hiring a licensed electrician for the install — the model we've supported for years — routinely lands 20 to 35 percent below national-brand turnkey quotes. Our solar installation guide and permitting guide map that path step by step.
Panel Price Tiers: What the Equipment Itself Costs
Wholesale module pricing in 2025 sat near historic lows, thanks to massive global manufacturing overcapacity. For buyers, that means the spread between tiers is about watts-per-dollar and warranty depth, not basic competence — even value-tier panels from established manufacturers are reliable products.
| Tier | Wholesale module price | Typical efficiency | Representative brands | Warranty (product/performance) |
|---|---|---|---|---|
| Value | $0.20–$0.28/W | 20.5–21.8% | JA Solar, Trina, Jinko | 12–15 yr / 25–30 yr |
| Mainstream premium | $0.28–$0.38/W | 21.5–22.5% | Qcells, REC, Silfab | 25 yr / 25–30 yr |
| Top premium | $0.38–$0.55/W | 22.0–24.0% | Maxeon (SunPower), premium Panasonic-class | 25–40 yr / 30–40 yr |
On a 10 kW system, the jump from value to top-premium modules is roughly $1,800 to $3,500 of equipment cost — real money, but a fraction of the quote. Pay it when roof space is constrained (higher efficiency means fewer panels for the same watts) or when you value the long product warranty; skip it when space is abundant and budget rules. We stock across tiers — JA Solar, Trina, Qcells, REC, and Mission Solar among them — precisely because the right answer varies by roof. Our panel comparison page and Qcells vs. Trina vs. JA head-to-head go deeper on the trade-offs.
Incentives: The 2025–2026 Landscape, Stated Plainly
Here's the part most solar marketing won't say clearly. The federal Residential Clean Energy Credit — the 30 percent credit under Section 25D that defined solar economics for two decades — expired for systems placed in service after December 31, 2025, under the tax law enacted in mid-2025. If your system was installed and operational by the end of 2025, the 30 percent credit applies to that tax year. Systems placed in service in 2026 and later do not get the residential credit.
What remains:
- State and local programs. State tax credits (where they exist), property-tax exclusions for solar value, sales-tax exemptions, and utility rebates vary wildly by address. Our solar incentives by state page tracks the major ones.
- Net metering. The value of exported power — full retail in some states, avoided-cost in others — now swings project economics more than any credit. Know your utility's export rate before you size the system.
- SREC markets. In states with solar renewable energy certificate programs (New Jersey, Massachusetts, Maryland, D.C., Pennsylvania, and a few others), production generates sellable certificates worth real money for years.
The loss of the credit raises the stakes on price discipline: at $3.00/W gross with no federal credit, a well-shopped $2.50/W system just outperformed a lazily-bought $3.50/W system by more than the credit ever saved. Shopping matters more in 2026, not less.
Payback and Long-Term Value
Payback math is local, but the structure is universal: annual savings equal your system's annual production multiplied by your effective electricity rate, minus any fixed charges solar can't avoid. A 10 kW system producing 14,000 kWh a year (typical for the Midwest-to-Southwest band) saves $1,680 annually at $0.12/kWh, $2,240 at $0.16, and $2,800 at $0.20. Against a well-bought $27,500 gross cost:
| Effective rate | Annual savings (14,000 kWh) | Simple payback, $27,500 system | 25-year cumulative savings (undiscounted) |
|---|---|---|---|
| $0.12/kWh | $1,680 | 16.4 years | ~$42,000 |
| $0.16/kWh | $2,240 | 12.3 years | ~$56,000 |
| $0.20/kWh | $2,800 | 9.8 years | ~$70,000 |
| $0.25/kWh | $3,500 | 7.9 years | ~$87,500 |
Two honest adjustments to that table. First, panels degrade — plan on about 0.5 percent per year for quality modern modules, so year-25 production runs roughly 88 percent of year one. Second, rates historically rise 2 to 3 percent annually, which improves every future year; the two effects roughly cancel in simple models, which is why the undiscounted column is a fair first approximation. Run your own address through our solar ROI calculator and system calculator rather than trusting anyone's averages — including mine.
What Drives Production — and Therefore Your Real Savings
A dollar of solar equipment in Phoenix is not a dollar of solar equipment in Seattle, because production per installed watt varies by nearly two-to-one across the country. Three variables control your system's output. First, solar resource: a south-facing array in the Southwest harvests 1,700 to 1,900 kWh per kW installed per year, the Midwest and Mid-Atlantic manage 1,200 to 1,400, and the Pacific Northwest and northern New England run 1,000 to 1,200. Second, orientation and tilt: true south at latitude tilt is the benchmark, east or west arrays give up roughly 15 to 20 percent, and flat or north-facing installs can sacrifice 30 percent or more. Third, shading — the silent killer. Because panels in a string share current, one shaded panel can drag down its whole string, which is why shade-prone roofs justify microinverters or optimizers despite their premium. When a quote promises production, check that the modeler used your actual roof planes, your actual tilt, and a shading scan rather than generic defaults; a 15 percent production overestimate is a 15 percent payback lie.
The Installation Process and Its Hidden Line Items

A straightforward residential install runs one to three days on the roof plus a half-day of electrical tie-in — but the scope around that core is where quotes diverge. Know these line items before you compare bids. Main panel upgrades: older 100-amp panels often lack busbar capacity for solar backfeed under the NEC 705.12 120-percent rule, and a panel upgrade adds $1,500 to $4,000. Roof condition: reroofing before install is far cheaper than removing and reinstalling the array later — an R&R for a re-roof runs $2,000 to $5,000, so if your shingles have under ten years of life, handle the roof first. Trenching for ground mounts or detached garages adds $1,000 to $3,000. Structural issues — undersized rafters, spans requiring engineering letters — add inspection and engineering fees of $300 to $1,500. Monitoring and consumption metering can add a few hundred dollars but pay for themselves in early fault detection; I've caught two failed optimizers and one rodent-chewed string within weeks because the monitoring flagged the anomaly, and both were warranty calls instead of mystery losses. None of these items is a scam — they're legitimate scope. The scam is the quote that omits them to look cheap and invoices them later.
Where Batteries Fit Into the Cost Picture
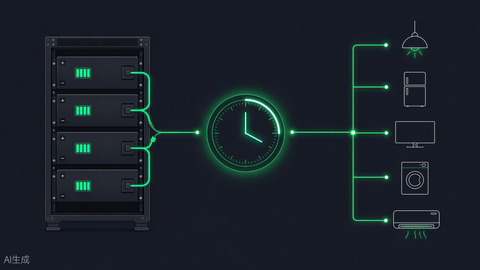
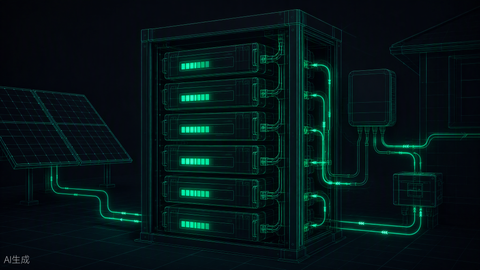
Storage changes both the price and the value proposition. A 10 to 13.5 kWh battery installed alongside solar adds roughly $9,000 to $16,000 to the project — call it $1,000 to $1,300 per kWh installed. In full-retail net-metering states, a battery is mostly a resilience purchase: the grid is already your free battery, so you're buying outage protection, not economics. In avoided-cost or time-of-use export markets — California's NEM 3.0 being the famous case — storage is what makes solar economics work at all, because shifting your own production into evening peaks can be worth two to four times the daytime export rate. Size storage to your critical loads and your rate structure, not to a salesperson's quota: our battery sizing calculator handles the first, and your utility tariff sheet answers the second. If you're comparing battery ecosystems, the EG4 vs. Tesla Powerwall comparison and our EG4 battery lineup cover the value end of the market in detail.
Soft Costs: Why Your Zip Code Sets the Price
Two identical systems — same panels, same inverter, same size — can legitimately differ by $8,000 between markets, and the difference is almost entirely soft costs. Permitting burden is the first driver: some jurisdictions approve a residential solar permit over the counter in a day for $150, while others demand structural engineering letters, multiple revision cycles, and $1,000-plus in fees. Interconnection is the second: utilities with mature solar territories process applications in days, while others run month-long queues with study fees. Labor is the third — prevailing wages, licensing requirements, and crew availability in the Northeast and coastal metros run well above Sun Belt rates. Finally, competition matters more than any single input: metros with dozens of hungry installers price near cost-plus, while markets dominated by one or two national brands price at whatever the financing allows. The practical takeaway: national average prices are a reference point, not a verdict on your quote. Your benchmark is what three local bidders put in writing.
DIY and Supply-House Buying: The Quiet 30 Percent
Because hardware is now the minority of a turnkey quote, the single biggest lever a homeowner has is unbundling equipment from installation. Buy the panels, inverter, racking, and balance-of-system from a supply house at transparent prices, then hire a licensed local electrician or solar contractor for the install at a straight labor rate. The savings typically run 20 to 35 percent against a national-brand turnkey quote — on a 10 kW project, that's $6,000 to $12,000. The trade-offs are real, so weigh them honestly: you become the general contractor, coordinating the permit package, the utility interconnection application, and the inspection schedule; workmanship warranty comes from your installer rather than a national brand; and you need enough project confidence to catch scope problems early. For homeowners with a handy streak or a trusted electrician, it's the best value in the industry — our installation guide and permitting guide exist precisely for this path, and our 5 kW kit and 10 kW battery kit pages show what pre-engineered equipment packages look like. For homeowners who want one throat to choke and a single warranty, turnkey remains worth its premium — just shop it against the unbundled price so you know what the premium actually is.
How You Pay: Cash, Loan, Lease, PPA
| Financing | How it works | Effective cost impact | Watch out for |
|---|---|---|---|
| Cash | You buy the system outright | Cheapest total cost; full savings from day one | Ties up capital |
| Solar loan | 10–25 yr secured or unsecured loan | Dealer fees of 15–30% are often baked into the loan principal | A "$0-down, 2.99%" quote can hide $8,000 of fee markup; ask for the cash price |
| Lease | Fixed monthly payment for the panels | You save 10–30% on your bill; provider keeps incentives | Escalators of 1–3.9%/yr; complicates home sales |
| PPA | You buy the power at a set rate | Similar to lease, paid per kWh | Same escalator and transfer issues |
The dealer-fee row deserves emphasis because it's the single largest hidden cost in residential solar. A "$30,000 financed system" frequently represents a $23,000 cash price plus $7,000 of loan fees. Always demand the cash price in writing from every bidder; it normalizes the comparison instantly. I've watched customers save five figures with that one question.
The Future of Solar Pricing
Two forces are pulling residential solar prices in opposite directions as we move through 2026. Module prices themselves remain near historic lows — global manufacturing capacity still exceeds demand, and wholesale panels in the low-to-mid twenty-cents-per-watt range continue to arrive. At the same time, soft costs face upward pressure: interconnection queues are lengthening in high-adoption territories, permitting departments are stretched, and the disappearance of the federal residential credit removed the cushion that once masked sloppy pricing. The wild card is trade policy — tariff actions on cells and modules have historically added 10 to 20 percent to equipment costs within a quarter of taking effect, and buyers in mid-project feel it first. The structural trend, though, is friendly to buyers: equipment gets cheaper every year while installation discipline decides who captures the savings. Portable and small-format solar is growing in parallel — a market that barely existed five years ago — but for whole-home economics, the rooftop system remains the main event.
How to Read a Quote Without Getting Burned
Every legitimate quote should state, in writing: system size in kW DC; estimated annual production in kWh with the modeling tool named (PVWatts, Aurora, Helioscope); module and inverter make and model; the cash price; the per-watt gross cost; warranty terms for equipment, workmanship, and roof penetrations; and who's responsible for interconnection paperwork. Red flags: quotes sized off satellite imagery alone without a roof assessment, production estimates using unrealistically high sun hours, "today only" pricing, and any reluctance to disclose the cash price. Get three bids minimum, and make at least one of them a supply-house-plus-local-electrician quote — it's the market's truth serum. When you're ready, request a quote and we'll price the equipment honestly.
Frequently Asked Questions
How much does a home solar system cost in 2025?
A typical 8 to 11 kW residential system ran $24,000 to $36,000 before incentives through 2025, or roughly $2.75 to $3.50 per watt depending on market. Well-shopped systems in competitive metros closed near the bottom of that range, and supply-plus-local-electrician installs often beat it entirely.
Is the 30 percent federal solar tax credit still available?
Not for new residential systems. The Section 25D Residential Clean Energy Credit applied to systems placed in service by December 31, 2025. Systems installed in 2026 or later rely on state incentives, net metering value, and SREC markets instead — which makes buying at a fair gross price more important than ever.
Why are two solar quotes for the same house $10,000 apart?
Almost never because of equipment. Sales acquisition costs (especially door-to-door channels), loan dealer fees of 15 to 30 percent baked into financed prices, and installer margin account for the spread. Compare cash prices per watt and you'll see through it immediately.
How long do solar panels take to pay for themselves?
Eight to thirteen years is the honest range in most of the country at 2025–2026 prices without the federal credit — under eight years in high-rate markets like California and the Northeast, past fifteen in low-rate, low-sun regions. Rising utility rates steadily improve the back half of every system's life.
Do solar panels increase home value?
Owned systems do — studies including Zillow's and Lawrence Berkeley National Lab's have found sale premiums around 3 to 4 percent of home value for owned systems. Leased systems and PPAs do not add comparable value and can complicate sales, since the buyer must qualify to assume the contract.
The Bottom Line on 2025 Solar Costs
Equipment has never been cheaper, soft costs have never been a bigger share of the quote, and the federal safety net for sloppy pricing is gone. Buyers who compare cash prices, verify production modeling, and understand the cost stack will do as well in 2026 as buyers with the credit ever did. Start your planning with the system sizing calculator, check your state's programs on the incentives page, understand your hardware options through the inverter buyer's guide and battery buyer's guide. The sun's price hasn't changed; only the shopping discipline required has.