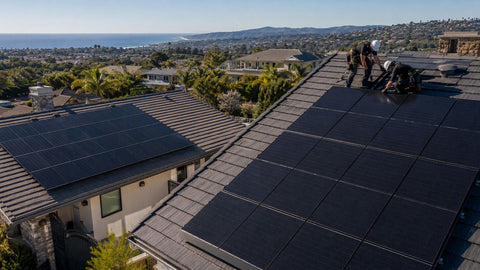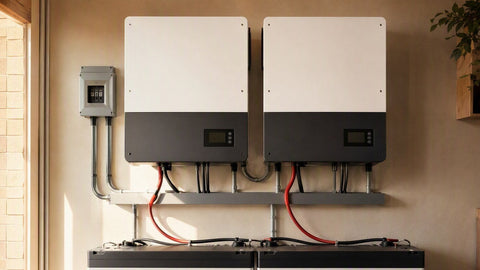
In 2026, the national average cost to install a residential solar system in the United States ranges from approximately $2.58 to $3.50 per watt before any incentives, depending on the data source and market segment. For a typical 12 kW system — the size that EnergySage identifies as the current U.S. average — that translates to a total installed cost between $30,240 and $34,800 on a cash basis, before federal, state, or utility incentives are applied.
According to EnergySage Marketplace data from early 2026, the average 12 kW residential system costs $31,135 before incentives, with a per-watt price of roughly $2.58–$2.60. SolarReviews, reporting in August 2026, cites a higher average of $3.03 per watt for cash purchases on a 7.2 kW system, or $21,816 total, reflecting the wide variance driven by geography, roof complexity, and installer markup. Lawrence Berkeley National Laboratory (LBNL) data referenced by NRG Clean Power places the national median closer to $3.50 per watt for cash transactions. SEIA and Wood Mackenzie, in their Q1 2026 Solar Market Insight report, pegged residential system pricing at $3.35 per watt DC — down 7% year-over-year, but still subject to significant regional spread.
Sources: EnergySage Marketplace (early 2026); SolarReviews (August 2026); SEIA / Wood Mackenzie Q1 2026 Solar Market Insight; LBNL via NRG Clean Power (2026).
The math behind solar pricing is straightforward, but the inputs vary enough that two quotes for the same address can differ by thousands of dollars. The core formula is:
Total Installed Cost = System Size (kW) × Price per Watt ($/W) × 1,000
For example, a 10 kW system at $2.70/W = 10 × 2.70 × 1,000 = $27,000 before incentives.
System size is determined by your annual electricity consumption, available roof space, and local solar irradiance. A typical U.S. home using 10,000–12,000 kWh per year generally needs an 8 kW to 12 kW system, depending on geography. In sunnier states like Arizona or Texas, a smaller array produces the same annual energy as a larger one in Massachusetts or New Hampshire. Price per watt, meanwhile, is driven by hardware costs, labor rates, permitting fees, installer overhead, and local market competition.
It is critical to distinguish between gross cost (the sticker price) and net cost (after incentives). For 2026, the net-cost calculation has changed dramatically for homeowners: the Section 25D residential clean energy credit expired on December 31, 2025, which means there is no longer a 30% federal tax credit subtracted from the gross price for new homeowner-owned installations. Any quote or calculator still showing a 30% federal reduction for 2026 residential systems is factually outdated. We cover this in detail in the federal tax credit section below.
For contractors reading this guide, the per-watt figure you quote to clients should be all-in: panels, inverters, racking, electrical balance-of-system (BOS), labor, permits, interconnection, sales tax, and your margin. Breaking those out transparently — as we do in the cost breakdown table below — builds trust and reduces sticker shock.
The table below shows estimated installed costs for common residential system sizes, synthesized from EnergySage Marketplace data, NRG Clean Power competitive marketplace ranges, and SolarReviews cash-price averages. All figures are before incentives and reflect 2026 pricing.
| System Size | Low $/W | Avg $/W | High $/W | Total Cost (before incentives) |
|---|---|---|---|---|
| 4 kW | $2.86 | $3.25 | $3.64 | $11,440 – $14,560 |
| 6 kW | $2.66 | $3.00 | $3.32 | $15,960 – $19,920 |
| 8 kW | $2.61 | $2.85 | $3.15 | $20,880 – $25,200 |
| 10 kW | $2.55 | $2.70 | $3.00 | $25,500 – $30,000 |
| 12 kW | $2.52 | $2.60 | $2.90 | $30,240 – $34,800 |
| 15 kW | $2.44 | $2.55 | $2.80 | $36,600 – $42,000 |
Source: Synthesized from EnergySage Marketplace (early 2026), NRG Clean Power marketplace range ($2.58–$2.75/W, July 2026), and SolarReviews cash averages (August 2026).
Notice the inverse relationship between system size and per-watt pricing. A 4 kW system costs more per watt than a 15 kW system because fixed costs — permitting, site assessment, interconnection application, and mobilization — are spread over fewer watts. This is why contractors often advise clients against undersizing: the marginal cost of adding two or three extra kilowatts is lower than the average cost of the whole array, and the customer captures more energy production per dollar spent.
Homeowners with electric vehicles, heat pumps, or pool equipment should size toward the 10–15 kW range. If you are unsure what size fits your load profile, our residential solar starter kits bundle panels, inverters, and racking in pre-engineered configurations that simplify sizing decisions.
Most homeowners assume the solar panels themselves dominate the bill. They do not. On a typical 12 kW residential installation, the panels account for only about 12% of the total cost. The majority of the budget goes to soft costs — permitting, marketing, overhead, installer profit, and interconnection — plus labor and electrical balance-of-system components.
The following breakdown is derived from EnergySage Marketplace and NRG Clean Power cost-allocation data for a representative 12 kW residential system priced at approximately $31,135 before incentives:
| Component | Avg Cost (12 kW) | % of Total |
|---|---|---|
| Solar panels | $3,736 | 12% |
| Inverter(s) | $3,114 | 10% |
| Racking equipment | $934 | 3% |
| Electrical wiring / BOS | $2,802 | 9% |
| Supply chain costs | $2,802 | 9% |
| Sales tax | $623 | 2% |
| Installation labor | $2,179 | 7% |
| Sales & marketing | $5,604 | 18% |
| Overhead | $3,425 | 11% |
| Installer profit | $3,425 | 11% |
| Permitting & interconnection | $2,491 | 8% |
Source: EnergySage Marketplace cost breakdown (2026); NRG Clean Power component allocation.
The key takeaway for trade professionals and cost-conscious homeowners is this: hardware — panels, inverters, and racking — represents only about one-quarter of the installed price. The remaining roughly 48% is soft costs (marketing, overhead, profit, permitting) and labor. This is precisely why sourcing equipment directly from a wholesale distributor and either self-installing or hiring an independent contractor can yield substantial savings. A homeowner who buys solar panels, inverters, and racking at wholesale prices and pays only for labor and permits can often cut 30–40% off the all-in installer quote.
For contractors, this breakdown is also a quoting tool. When a client balks at a $30,000 proposal, walking them through the line items — especially the 18% allocated to sales and marketing, which they are effectively paying for — can open the door to an equipment-only purchase discussion. PES supplies the hardware; you supply the labor and expertise.
Solar pricing is not uniform across the country. Labor rates, permitting complexity, market competition, incentive structures, and even shipping distances to solar warehouses all push costs up or down by state. The table below shows 2026 per-watt and system-cost benchmarks for eleven states, compiled from EnergySage local data, SolarReviews regional averages, and NRG Clean Power marketplace snapshots:
| State | Avg $/W | Avg 12 kW System Cost | Key Market Factors |
|---|---|---|---|
| Arizona | $2.09 | ~$25,080 | Very competitive market; strong sun; low labor costs |
| California | $2.48–$3.14 | ~$29,760–$37,680 | High labor; NEM 3.0 export credits reduced; SGIP battery rebates |
| Florida | $2.20 | ~$26,400 | No state income tax; strong sun; competitive installer landscape |
| Hawaii | $3.23 | ~$38,760 | Highest in nation; import shipping costs; limited local competition |
| Massachusetts | $3.17 | ~$38,040 | High labor costs; SMART declining-block program active |
| Texas | ~$2.35 | ~$28,200 | Competitive deregulated market; strong sun; CPS/Oncor utility rebates vary |
| New Hampshire | $3.15+ | ~$37,800+ | Higher end of national range; smaller installer base |
| New York | ~$2.95 | ~$35,400 | NY-Sun megawatt-block rebates; high labor; strong incentive stack |
| New Jersey | ~$2.85 | ~$34,200 | SREC-II / SuSI transition program; competitive market |
| Ohio | ~$2.75 | ~$33,000 | Midwest pricing; moderate competition; net metering varies by utility |
| Michigan | ~$2.90 | ~$34,800 | Moderate sun; utility-specific rebates; growing installer base |
Source: EnergySage local marketplace data (2026); SolarReviews regional averages (August 2026); NRG Clean Power state snapshots (July 2026); DSIRE database for program verification.
Arizona and Florida currently offer the most attractive combination of low per-watt pricing and high solar resource, while Hawaii and Massachusetts sit at the opposite end of the spectrum. California remains the largest volume market but shows wide regional variance — from competitive Central Valley pricing to premium Bay Area and coastal labor rates. Contractors quoting multi-state jobs should use these benchmarks as starting points, then adjust for roof type, electrical service size, and AHJ permitting timelines.
This is the single most consequential policy shift affecting solar costs in 2026, and the majority of competing guides on the internet are getting it wrong. If you read one section of this article carefully, make it this one.
Section 25D Expired on December 31, 2025
The Section 25D Residential Clean Energy Credit — the 30% federal tax credit that homeowners have claimed for solar, battery storage, and related equipment for more than a decade — expired for systems placed in service after December 31, 2025. The expiration was enacted by the One Big Beautiful Bill (OBBB), signed into law by President Trump on July 4, 2025. The Inflation Reduction Act (Pub.L. 117-169) had previously extended the 30% rate through 2032, but the OBBB repealed that extension for residential installations.
What Replaced It: Section 48E (Commercial / Third-Party Owned)
For commercial, industrial, and third-party-owned systems — including leases and power purchase agreements (PPAs) — the Section 48E clean energy credit remains available, but with tightened deadlines. To qualify, projects must either begin construction on or before July 4, 2026, or be placed in service by December 31, 2027. This creates a narrow window for developers and financiers still structuring lease and PPA deals.
What this means in practice:
- Homeowner cash purchase: No federal tax credit. Budget the full gross cost.
- Homeowner loan purchase: No federal tax credit. The loan principal covers gross cost.
- Lease or PPA: The leasing company may still claim Section 48E if construction began by July 4, 2026, or the system is placed in service by December 31, 2027. The homeowner does not claim the credit directly; any benefit is priced into the lease rate or PPA tariff.
- Commercial / non-residential: Section 48E may still apply, subject to the construction and placed-in-service deadlines above.
Source: One Big Beautiful Bill (OBBB), signed July 4, 2025; SEIA analysis of OBBB clean energy provisions (seia.org/research-resources/clean-energy-provisions-big-beautiful-bill/); Inflation Reduction Act (Pub.L. 117-169) for pre-2026 ITC history.
Buyer-Impact Block: What This Means for Your 2026 Decision
The removal of the 30% credit changes the economics of solar materially. Under the old regime, a $31,000 system became a $21,700 net investment after the credit. Today, that same system costs the full $31,000 — a $9,300 increase in real out-of-pocket cost for the same hardware. Simple payback periods that previously ran 6–8 years are now stretching to 9–12 years in many markets, depending on local electricity rates and net metering rules.
However, this also creates opportunities:
- Equipment-only purchases are more attractive than ever. Since there is no tax credit to capture through a turnkey installer, the savings from buying hardware wholesale and hiring labor separately are pure cash savings.
- Battery add-ons should be evaluated carefully. Without the 30% credit covering storage, a battery backup kit must pencil out on backup value and time-of-use arbitrage alone.
- State and utility incentives become more important. Programs like California's SGIP, Massachusetts' SMART, and New York's NY-Sun now carry more weight in the net-cost calculation. Always verify current availability through the DSIRE database (programs.dsireusa.org).
For contractors, the policy shift is also a conversation starter. Clients who delayed installation hoping for a credit revival need clear, authoritative guidance. Being the installer or supplier who explains the new reality accurately — rather than quoting fantasy numbers — separates professionals from lead-gen operations.
With the federal residential tax credit no longer available, financing structure matters more than ever. The table below compares six common ways to pay for solar in 2026, including ownership implications, monthly payment characteristics, and key risks:
| Method | Ownership | Upfront Cost | Monthly Payment | Key Pros | Key Cons |
|---|---|---|---|---|---|
| Cash | You | Full system cost | $0 | Highest lifetime savings; no interest | Large capital outlay |
| Solar Loan | You | $0–$2,000 | $100–$350 | Own the system; loan interest may be deductible | Interest adds 15–35% to total cost; no ITC to offset |
| Lease | Leasing co. | $0 | $80–$250 | No maintenance risk; predictable payment | No ownership; no equity; escalator clauses common |
| PPA | Provider | $0 | Per-kWh charge | Pay only for production; no upfront cost | No ownership; rate may escalate; savings shrink over time |
| PACE | You | $0 | Added to tax bill | No credit check; transferable on sale | High interest; senior lien on property; limited states |
| HELOC | You | $0 | Variable | Lower rates than solar loans; tax-deductible interest possible | Uses home equity; variable rate risk |
Source: EnergySage financing guide (2026); SolarReviews loan-vs-cash analysis (August 2026); PACE program disclosures via DSIRE database.
With no federal tax credit to monetize, cash and low-interest HELOC purchases now offer the clearest path to positive ROI. Solar loans still work for buyers who prefer to preserve liquidity, but the absence of the ITC means the interest burden is no longer offset by a tax credit — a meaningful change from pre-2026 economics. SolarReviews reports that the average loan-financed 7.2 kW system in August 2026 carries an effective cost of $3.62 per watt, or $26,004 total, compared to $3.03 per watt ($21,816) for cash — a $4,188 premium for financing.
Leases and PPAs remain viable for homeowners who cannot or will not pay cash, but the fine print matters. Escalator clauses that raise payments 2.5–3.5% annually can erase savings by year 10 if local utility rates do not keep pace. Contractors should be prepared to explain these trade-offs to clients who are comparing a cash equipment purchase through PES against a zero-down lease proposal.
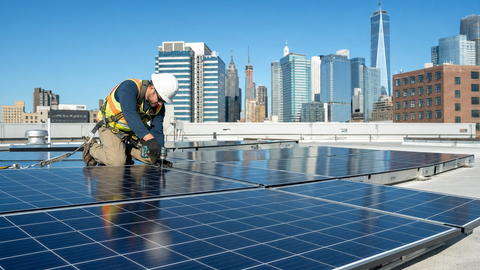
Commercial and industrial (C&I) solar systems benefit from economies of scale that residential projects cannot match. Labor costs per watt fall because crews stay on site longer with less mobilization downtime. Bulk equipment purchasing reduces module, inverter, and BOS pricing. Permitting and interconnection fees, while higher in absolute dollars, shrink as a percentage of total project cost.
The table below shows estimated installed costs for common commercial system tiers. Note that commercial projects may still qualify for Section 48E credits if they meet the OBBB construction or placed-in-service deadlines:
| System Size | Avg $/W | Total Cost (before incentives) | Typical Application |
|---|---|---|---|
| 25 kW | $2.20–$2.60 | $55,000–$65,000 | Small business, retail strip, church |
| 50 kW | $2.00–$2.40 | $100,000–$120,000 | Mid-size office, warehouse, multi-tenant |
| 75 kW | $1.90–$2.30 | $142,500–$172,500 | Large retail, manufacturing, cold storage |
| 100 kW | $1.80–$2.20 | $180,000–$220,000 | Industrial facility, car dealership, school |
| 250 kW+ | $1.50–$1.90 | $375,000+ | Distribution center, campus, agricultural |
Source: SEIA / Wood Mackenzie Q1 2026 Solar Market Insight (C&I pricing trends); NRG Clean Power commercial marketplace benchmarks (July 2026).
Commercial systems also unlock depreciation benefits unavailable to residential owners. Under current tax law, businesses can claim bonus depreciation on solar assets, further improving project economics even without the residential ITC. Contractors who serve the C&I segment should partner with a tax advisor or CPA to model MACRS depreciation schedules for clients.
For commercial projects, PES supplies Tier 1 modules, string and central inverters, and commercial-grade racking at wholesale pricing. Contact our team through my.pesdistribution.com for volume quotes on 25 kW and larger systems.
As the cost breakdown table showed, panels and inverters represent only about 25% of a turnkey installation price. The rest is labor, overhead, profit, and soft costs. For contractors who know how to install — and for homeowners who have a trusted electrician or roofer — buying equipment at wholesale prices is the single largest lever for reducing total project cost.
Here is how the savings break down in practice. A 10 kW system quoted at $2.70/W by a national installer costs $27,000. The hardware inside that quote — panels, inverter, racking, wiring, and BOS — is worth roughly $8,500 at distributor pricing. The remaining $18,500 covers labor, permits, marketing, overhead, and profit. If a contractor sources the $8,500 hardware bundle directly and charges $6,000 for labor and permits, the homeowner pays $14,500 instead of $27,000 — a 46% reduction — while the contractor still earns a healthy labor margin.
For trade professionals, the keys to making this model work are:
- Reliable supply chain: Delays kill project timelines. Work with a distributor that holds U.S. inventory and can confirm stock before you pull permits.
- Compatible bill of materials: Mismatched panel voltage, inverter string sizing, or racking attachments create callbacks. Use pre-engineered kits or verify compatibility with the distributor's technical team.
- Warranty support: Ensure the distributor honors manufacturer warranties and can facilitate RMAs if a module or inverter fails.
- Code compliance: Equipment must carry UL 61730, UL 1741 SA, or equivalent certifications for the AHJ and utility interconnection approval.
Portlandia Electric Supply operates both a retail storefront at portlandiaelectric.supply and a dedicated B2B portal at my.pesdistribution.com for contractors, installers, and EPCs. The portal offers live wholesale pricing, volume tiers, and trade-account terms on solar panels, inverters, battery backup kits, and pre-bundled starter kits. If you quote solar jobs regularly, the spread between retail and portal pricing can determine whether you win or lose a bid.
Contractors: Get Live B2B Pricing
Sign in to my.pesdistribution.com for real-time wholesale pricing, volume discounts, and trade terms.
Open B2B PortalThe per-watt and system-size tables above cover the core hardware and installation labor. But several ancillary costs routinely surprise first-time solar buyers and underprepared contractors. Build these into every proposal:
Permits and Interconnection
Permitting fees vary widely by AHJ. Some cities charge $200–$400 for a solar permit; others, particularly in California and the Northeast, charge $800–$1,500 or require structural engineering letters. Interconnection application fees from the utility typically run $100–$500, with additional costs if a line upgrade or transformer swap is needed. The EnergySage breakdown allocates approximately $2,491 (8%) of a 12 kW system cost to permitting and interconnection.
Inspections
Most jurisdictions require a rough electrical inspection and a final inspection before Permission to Operate (PTO) is granted. Some AHJs also require a structural inspection for roof-mounted arrays. Inspection scheduling delays — especially in busy markets — can push project completion out by weeks. Contractors should pad timelines accordingly and charge for re-inspections if the initial inspection fails due to workmanship issues.
Tree Trimming and Roof Work
Shading from trees can reduce array output by 20–50%. If the homeowner does not want to remove trees, microinverters or power optimizers may be necessary, adding $0.15–$0.25/W to inverter costs. If the roof is more than 10–15 years old, many installers require replacement before mounting panels. A partial re-roof can add $5,000–$12,000 to the project, though it is technically a roofing expense rather than a solar expense.
Electrical Service Upgrades
Older homes with 100-amp main panels may need a 200-amp upgrade to accommodate solar backfeed, especially if an EV charger or battery is also planned. Service upgrades range from $1,500 to $4,000 depending on the utility and local electrician rates.
Monitoring and Maintenance
Most inverters include free monitoring for 5–12 years via a web portal or app. After that, premium monitoring subscriptions may cost $50–$150 per year. Annual maintenance — panel cleaning, vegetation management, and inverter health checks — is often overlooked but can preserve production levels. In dusty climates like Arizona or agricultural areas, cleaning twice per year is advisable.
Tariff and Trade Risk
Section 232 Minimum Import Price (MIP) requirements, established under Proclamation 11052 (Federal Register Doc. 2026-16400, 91 FR 51975), take effect December 4, 2026. The proclamation establishes floors of $21/kg for polysilicon, $100/kg for wafers, $0.22/W for cells, and $0.38/W for modules, plus a 15% ad valorem duty. With module prices at approximately $0.34/Wdc in Q1 2026 (per SEIA), the $0.38/W floor represents a potential price increase for imports not covered by pre-August 6, 2026 contracts. Contractors quoting projects for late 2026 or 2027 completion should include a tariff contingency clause or secure equipment early.
An accurate solar quote requires more than a roof size and zip code. The most reliable estimates are built from site-specific data. Before contacting any installer or distributor, gather the following:
- Last 12 months of electricity bills: This determines your annual kWh consumption and helps size the array correctly.
- Roof measurements and photos: Know the usable square footage, pitch, azimuth, and any obstructions (chimneys, vents, skylights).
- Electrical panel specs: Confirm your main panel amperage, available breaker space, and service entrance location.
- Shading analysis: Use a solar pathfinder, drone survey, or satellite imagery tool to identify shading hours by season.
- Local AHJ requirements: Some jurisdictions require structural engineering, fire setbacks, or specific rapid shutdown compliance that affects design and cost.
With this information, a reputable installer or distributor can produce a line-item quote that includes hardware, labor, permits, interconnection, and warranty terms. Avoid any proposal that hides costs in a single lump sum or promises a price without a site visit or detailed remote assessment.
If you are a homeowner ready to compare options, request a wholesale quote from Portlandia Electric Supply. We will review your usage profile, roof characteristics, and equipment preferences to produce a transparent, itemized proposal with no hidden markups.
Ready to Price Your System?
Get a transparent, itemized solar quote with wholesale hardware pricing.
Request a QuoteHow much does it cost to install solar panels in 2026?
The national average ranges from $2.58 to $3.50 per watt before incentives, depending on the data source. A typical 12 kW residential system costs between $30,240 and $34,800 on a cash basis. EnergySage reports an average of $31,135 for a 12 kW system in early 2026, while SolarReviews cites $3.03 per watt ($21,816 for a 7.2 kW system) in August 2026. Geography, roof complexity, and installer markup all drive variance.
Is there still a federal tax credit for solar in 2026?
No — not for homeowner-owned residential systems. The Section 25D Residential Clean Energy Credit expired on December 31, 2025, under the One Big Beautiful Bill (OBBB), signed July 4, 2025. The 30% credit no longer applies to systems placed in service after that date. Commercial and third-party-owned systems may still qualify under Section 48E if construction began on or before July 4, 2026, or the system is placed in service by December 31, 2027.
How much do solar panels cost per watt?
In 2026, residential solar costs $2.58–$3.50 per watt before incentives, with most competitive markets falling between $2.60 and $2.85. Arizona and Florida are near the low end at approximately $2.09–$2.20/W, while Hawaii and Massachusetts exceed $3.15/W. Commercial systems start around $2.20/W for small C&I projects and drop below $1.90/W for installations above 100 kW.
What size solar system do I need for my house?
Size your system to your annual electricity consumption. A typical U.S. home using 10,000–12,000 kWh per year generally needs an 8–12 kW array, depending on local solar irradiance. Sun-belt homes in Arizona or Texas can produce the same energy with a smaller system than homes in the Northeast. Review 12 months of utility bills, then divide annual kWh by your region's production ratio (typically 1.3–1.6) to estimate the required DC system size.
Are solar panels worth it without the tax credit?
They can be, but the economics have tightened. Without the 30% credit, simple payback periods have lengthened from 6–8 years to 9–12 years in many markets. The best returns are now found in states with high electricity rates, strong net metering, or active state rebates. Equipment-only purchases — buying hardware wholesale and hiring labor separately — can restore much of the lost savings by eliminating installer markup.
How much does it cost to add a battery to solar?
Residential battery storage typically adds $8,000–$15,000 per battery unit before incentives, depending on capacity and chemistry. A 10–15 kWh lithium iron phosphate (LFP) battery from a Tier 1 manufacturer generally lands in the $9,000–$12,000 range for the hardware alone, plus $1,000–$3,000 for installation, electrical upgrades, and commissioning. Without the 30% federal credit, batteries must pencil out on backup power value, time-of-use arbitrage, or participation in virtual power plant (VPP) programs.
Can I install solar panels myself to save money?
Technically yes, but practically it depends on your skill set and local regulations. DIY installation can eliminate labor costs, which represent roughly 7% of a turnkey quote. However, you must still pull permits, pass inspections, coordinate interconnection with the utility, and comply with NEC 690 requirements for rapid shutdown, grounding, and labeling. Most AHJs require a licensed electrician to sign off on the AC-side work. If you are not experienced with roof work and high-voltage DC wiring, the safety and code-compliance risks outweigh the labor savings.
Why is my solar loan quote higher than the cash price?
Loan quotes include interest and fees spread over the repayment term. SolarReviews reports that the average loan-financed 7.2 kW system in August 2026 costs $26,004 ($3.62/W effective), compared to $21,816 ($3.03/W) for cash — a $4,188 premium. Dealer fees embedded in solar loans, which can range from 10% to 25% of the loan principal, are often invisible to the borrower but baked into the quoted system price. Always ask for the cash price and the loan price separately, then compare the total cost of borrowing against a HELOC or personal loan from your bank.
How long does it take to break even on solar panels?
In 2026, with no federal residential tax credit, simple payback periods range from 9 to 15 years depending on your state's electricity rates, net metering rules, and system cost. States with high retail rates and full net metering — like California before NEM 3.0, or Massachusetts with the SMART program — still deliver sub-10-year paybacks. States with low rates and weak net metering may stretch beyond 15 years. Use a 25-year analysis window; most quality panels carry 25-year performance warranties and continue producing well beyond that.
Do solar panels increase home value?
Multiple studies, including LBNL's "Selling Into the Sun" analysis, have found that owned solar systems increase home values by approximately $3–$4 per watt of installed capacity. A 10 kW system could therefore add $30,000–$40,000 to resale value in markets where buyers understand energy costs. However, leased systems and PPAs can complicate sales, as buyers must assume the remaining contract term. Cash-owned or loan-owned systems transfer cleanly and are generally viewed as assets.
What is the cheapest way to go solar in 2026?
The lowest total cost is an equipment-only purchase from a wholesale distributor, paired with a licensed electrician or experienced solar installer for labor and permitting. This eliminates the 18% sales-and-marketing overhead and 11% installer profit embedded in turnkey quotes. The trade-off is project management: you become the general contractor, responsible for permitting, scheduling, utility coordination, and warranty registration. For homeowners with construction experience or a trusted contractor, this route can reduce all-in costs by 30–40%.
How do tariffs affect solar panel prices?
The Section 232 Minimum Import Price (MIP) regime, established under Proclamation 11052 (91 FR 51975), takes effect December 4, 2026. It imposes floors of $0.38/W for modules, $0.22/W for cells, $100/kg for wafers, and $21/kg for polysilicon, plus a 15% ad valorem duty. With Q1 2026 module prices near $0.34/W (SEIA), the $0.38/W floor represents a potential increase for modules not covered by pre-August 6, 2026 contracts. Contractors should lock in equipment pricing early or include tariff contingencies in late-2026 quotes.
In 2026, installing solar panels on a typical U.S. home costs between $2.58 and $3.50 per watt before incentives, with a 12 kW system landing in the $30,000–$35,000 range on a cash basis. The most important change this year is the expiration of the Section 25D federal tax credit — a policy shift that adds roughly $9,000 to the out-of-pocket cost of a 12 kW system compared to 2025 pricing. Every competitor still quoting a 30% federal reduction is working from outdated information.
For homeowners, the path to the best ROI now runs through equipment-only purchasing, state and utility incentive stacking, and transparent contractor relationships. For contractors and installers, the opportunity is to become the authoritative voice that clients trust — the professional who explains the real numbers, sources hardware efficiently, and delivers a project without surprise markups.
Whether you are a homeowner budgeting your first array or a contractor quoting your fiftieth job, start with real pricing, real policy facts, and real hardware. Request a quote from Portlandia Electric Supply for transparent residential pricing, or sign in to my.pesdistribution.com for live B2B wholesale rates, volume tiers, and trade-account terms.