Solar Panel Output: Summer vs Winter Production Guide
~17 min read · Mid-latitude US focus · Updated for 2026 module temperature coefficients

Solar panels make power twelve months a year, but not evenly — and the gap between a July and a December is bigger than most new owners expect. At mid-latitudes, a system routinely produces 2 to 2.5 times more energy in its best month than its worst. Understanding why, and planning around it, is the difference between an owner who loves their system in January and one who thinks it's broken.
We size and support systems in Kentucky and across the eastern half of the country, where the seasonal swing is real. I've fielded the December phone call — "my app says the array made 11 kWh yesterday, in July it did 38, what's wrong?" — enough times to know that seasonal education belongs in the sales process, not the service ticket. Nothing was wrong with that array, by the way. It was doing exactly what the physics said it would, and the owner's installer had simply never shown him the winter numbers. This guide is the explanation we give instead, with the math to back it and the tables to plan from.
Location matters more than any national average
Seasonal variation scales with latitude. Near the equator the swing is small; at 38°N (Louisville) it's large; at 48°N (Seattle, Fargo) it's dramatic. The numbers in this guide reflect mid-latitude conditions (35°–45°N). If you're in south Florida or the Southwest desert, your curve is flatter. If you're in Maine or Minnesota, it's steeper.
1. How Solar Output Is Measured


![) Enphase IQBATTERY-5P-1P-NA [240V]](https://cdn.shopify.com/s/files/1/0613/5188/6982/files/ZZ010600323_O1_600x600_bd13fb5a-1fd9-4103-b22c-d600878780d1_400x.jpg?v=1783632118)

Understanding Solar Panel Output
Solar Panel Output by Wattage & Location
Solar panels convert sunlight to DC power; the inverter converts DC to the AC your building uses. Panel wattage ratings come from Standard Test Conditions (STC): 1,000 W/m² of light, 25°C cell temperature. The roof almost never sees STC. Real output depends on sunlight intensity, duration, angle, temperature, and weather — which is why seasonal planning starts with units, not nameplates.
| Measurement | Definition | Example |
|---|---|---|
| Watts (W) | Instantaneous power at a moment | Panel producing 350W at noon |
| Kilowatt-hours (kWh) | Energy produced over time | System generating 25 kWh per day |
| Peak Sun Hours (PSH) | Hours of 1,000 W/m²-equivalent sunlight | 5.5 PSH average in July |
| Capacity Factor | Actual output vs. theoretical maximum | 18% annual capacity factor |
The one formula to memorize
Daily kWh = System Size (kW) × Peak Sun Hours × System Efficiency. Example: 6 kW × 5.0 PSH × 0.80 = 24 kWh per day. Every seasonal number in this guide is that formula with different PSH plugged in. Efficiency here bundles inverter losses, wiring, soiling, and temperature — 0.75–0.85 is the honest real-world range.
2. The Five Variables That Drive the Seasonal Swing

| Factor | Summer Conditions | Winter Conditions | Impact on Output |
|---|---|---|---|
| Daylight Hours | 14–16 hours | 8–10 hours | 40–50% difference |
| Sun Angle (Elevation) | 60°–75° at noon | 20°–35° at noon | 15–25% difference |
| Sunlight Intensity | ~1,000 W/m² | ~400–700 W/m² | 30–60% difference |
| Cloud Cover | 30–40% average | 50–70% average | 10–30% difference |
| Temperature | 85–100°F | 20–45°F | 5–15% efficiency gain in winter |
Four of the five punish winter; only temperature favors it. The sun angle deserves a special note: low winter sun forces light through more atmosphere, scattering and absorbing energy before it reaches the glass. Even a crystal-clear January day delivers weaker light than a hazy June afternoon. That's physics, not a panel defect — and it's why "but it was sunny all day" doesn't rescue winter production.
3. Summer Production: The Peak Months

Summer is when the array pays the bills. Around the June solstice, mid-latitude sites get roughly 14.5 hours of daylight — nearly double the winter minimum — and the sun crosses the sky high enough to hit the panels close to perpendicular for hours at a stretch.
| Characteristic | Typical Summer Values (June–August) |
|---|---|
| Daylight Hours | 14–15 hours per day |
| Peak Sun Hours (PSH) | 5.0–6.5 hours equivalent |
| Solar Noon Sun Angle | 70°–75° elevation |
| Average Daily Production | 4.5–5.5 kWh per kW installed |
| Production Window | 6:00 AM – 8:30 PM (meaningful output) |
| Monthly Output Share | ~11–13% of annual production per month |
Summer day, worked example
8 kW × 5.5 PSH × 0.85 efficiency = 37.4 kWh on a typical good day. Clear skies and moderate temperatures push the same system past 40 kWh. Many grid-tied homes generate more than they consume on summer afternoons and bank the difference as net-metering credits.
The summer caveat is heat. Solar cells lose roughly 0.3–0.5% of efficiency per degree Celsius above 25°C cell temperature, and cell temperature runs 20–35°C above ambient in direct sun. On a 95°F day the cells may sit at 130–150°F internally, clipping 10–15% off rated output. Long days overwhelm the heat penalty, but it explains why a mild May afternoon sometimes out-produces a brutal August one per sun-hour.
4. Winter Production: Planning for the Trough

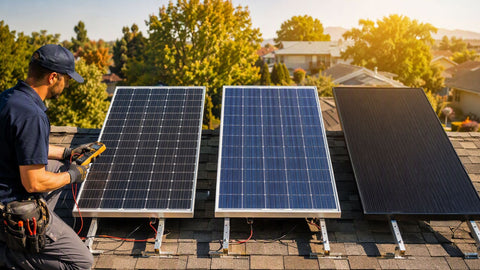
Winter flips every variable. Daylight shrinks toward 9 hours at the December solstice, the noon sun sits at 25–30° elevation, cloud cover thickens, and the same array that printed 1,000+ kWh in July delivers 400–550 kWh in December. That's a 50–60% drop, and it is normal.
| Characteristic | Typical Winter Values (December–February) |
|---|---|
| Daylight Hours | 9–10 hours per day |
| Peak Sun Hours (PSH) | 2.5–3.5 hours equivalent |
| Solar Noon Sun Angle | 25°–30° elevation |
| Average Daily Production | 2.0–3.0 kWh per kW installed |
| Production Window | 8:00 AM – 5:00 PM (meaningful output) |
| Monthly Output Share | ~5–7% of annual production per month |
Winter day, worked example
Temperature Effects on Panel Efficiency
8 kW × 3.0 PSH × 0.85 = 20.4 kWh on a decent winter day; an overcast one may deliver 8–12 kWh. The cold helps a little — panels convert more efficiently at low cell temperatures — but a 5–15% efficiency gain cannot close a 40–50% sunlight deficit. Anyone who tells you otherwise is selling something.
Snow is a two-sided coin. Fresh snow on the ground boosts output 1–5% through the albedo effect — reflected light reaching the glass. Snow on the panels blocks production until it slides or melts. Light accumulations usually clear themselves on tilted glass within a day or two; heavy wet accumulation on a low-tilt array can sit for a week. If you can clear panels safely from the ground with a soft roof rake, fine. Nobody's December production is worth a fall from a frozen roof.
5. Month-by-Month Production Curve

Month-by-Month Production Comparison
Monthly Production Distribution
The annual production curve is predictable enough to bank on. For a mid-latitude fixed-tilt system, the monthly shares look like this:
| Month | % of Annual Output | Relative Level | Avg Daily kWh/kW |
|---|---|---|---|
| January | 5.5% | Low | 2.3 |
| February | 6.5% | Low | 3.0 |
| March | 8.5% | Medium | 3.6 |
| April | 9.5% | Medium-High | 4.1 |
| May | 11.0% | High | 4.6 |
| June | 12.0% | Peak | 5.2 |
| July | 12.5% | Peak | 5.3 |
| August | 11.0% | High | 4.6 |
| September | 9.0% | Medium-High | 3.9 |
| October | 7.5% | Medium | 3.2 |
| November | 5.5% | Low | 2.4 |
| December | 5.0% | Lowest | 2.1 |
| Period | Share of Annual Output | Notes |
|---|---|---|
| March 21 – September 21 | ~65% | Peak half; expect surplus generation |
| September 21 – March 21 | ~35% | Trough half; grid supplementation likely |
We call it the 65/35 rule: at mid-latitudes, roughly 65% of annual production lands in the warm half of the year. When a customer asks "how much will I save," the honest answer is always an annual number, because any single month lies to you in both directions.
5A. How the Swing Varies by Region

The 65/35 split is a mid-latitude number. Move north and the curve sharpens; move toward the equator or the desert Southwest and it flattens. The driver is the winter peak-sun-hour floor:
| Region (Representative City) | Summer PSH | Winter PSH | Winter/Summer Ratio | Design Implication |
|---|---|---|---|---|
| Pacific Northwest (Seattle) | 5.5 | 1.5 | ~27% | Extreme swing; net metering essential; batteries rarely pencil on economics alone |
| Upper Midwest (Minneapolis) | 5.5 | 2.0 | ~36% | Steep tilt and snow management matter |
| Mid-Atlantic / Ohio Valley (Louisville) | 5.8 | 2.6 | ~45% | The 65/35 baseline this guide uses |
| Southwest Desert (Phoenix) | 7.5 | 4.5 | ~60% | Flattest US curve; heat derate is the summer issue |
| South Florida (Miami) | 5.5 | 4.0 | ~73% | Seasonal swing is modest; hurricane prep dominates design |
Two consequences follow. First, off-grid systems in northern climates must be designed to the December floor, which makes them two to three times larger than a "average-day" calculation suggests — this is the single most common off-grid undersizing error we see. Second, grid-tie economics in high-swing regions lean entirely on net-metering policy; an annual true-up at retail rate is worth far more in Minneapolis than the same policy in Miami, because there's more seasonal surplus to store on the grid's books.
5B. A Seasonal Maintenance Calendar That Follows the Physics

Maintenance timing should chase the production curve, not the calendar year. The schedule we recommend:
Solar Production During Winter Months
Winter Production Characteristics
- March–April: Pre-peak inspection. Clean off winter grime and pollen film before the high-value months. Check connections and mounting hardware after freeze-thaw cycles. Verify the monitoring baseline before summer data starts accumulating.
- June–July: Watch for clipping and heat derating, not faults. A system producing a flat-topped curve at solar noon on high-irradiance days is clipping at the inverter — normal if the DC/AC ratio was designed for it, worth a conversation if it wasn't.
- September–October: Second cleaning window in dusty or high-pollen regions. Trim vegetation before the low-sun season, when shadows stretch. This is the visit that pays for itself — a branch that barely matters in June can gut December production.
- December–February: Hands off, mostly. Don't chase snow off the roof. Do watch the monitoring for strings that drop to zero after a storm and stay there — that's a buried string, a tripped AFCI, or a connector that took water and froze, and it's the one winter event worth a service call.
6. The Temperature Paradox, Quantified

| Cell Temperature | Ambient Temp (Approx) | Efficiency Impact | Season |
|---|---|---|---|
| 10°C (50°F) | ~25°F | +5% to +7% | Winter |
| 25°C (77°F) | ~55°F | Baseline (0%) | Spring/Fall |
| 45°C (113°F) | ~80°F | −6% to −9% | Summer |
| 65°C (149°F) | ~100°F | −12% to −18% | Extreme Summer |
Temperature math, worked example
Silfab Elite 440W N-Type TOPCon Residential Solar Panel
Efficiency change = temperature coefficient × (cell temp − 25°C). A module at −0.35%/°C running at 60°C cell temperature: −0.35 × 35 = −12.3% output vs. nameplate. The same module at 10°C on a bright February day: −0.35 × (−15) = +5.3%. Modern N-type and TOPCon modules carry better coefficients (−0.29 to −0.32%/°C) than older PERC panels — one of the few spec-sheet lines worth paying for in hot climates. Our Silfab Elite N-type and Qcells XL-G11S datasheets publish their coefficients openly.
7. What One Panel Actually Produces, by Region

A standard 400W residential panel, by region:
| Output Period | Low Sun (3.5 PSH) Seattle, Portland |
Average (4.5 PSH) Denver, Atlanta |
High Sun (6 PSH) Phoenix, Las Vegas |
|---|---|---|---|
| Per Day | 1.4 kWh | 1.8 kWh | 2.4 kWh |
| Per Month | 42 kWh | 54 kWh | 72 kWh |
| Per Year | 511 kWh | 657 kWh | 876 kWh |
Same panel, 71% more energy in Phoenix than Seattle. This is why system sizing starts with your address's peak sun hours, not a national average — and why the 25 kW array breakdown and 200W panel reality check get so much traffic from people sanity-checking a quote.
8. Strategies That Actually Move the Needle

Battery Storage for Seasonal Balancing
How Storage Helps Each Season
| Strategy | How It Helps | Potential Gain |
|---|---|---|
| Optimal fixed tilt | Tilt near latitude balances the year | 5–15% vs. flat |
| Seasonal tilt adjustment | Steeper in winter catches low sun | 10–25% winter boost |
| South orientation | Maximizes annual exposure (N. Hemisphere) | 10–20% vs. east/west |
| Winter shade analysis | Bare trees and low sun create December shadows June surveys miss | Avoids 10–30% seasonal loss |
| Panel cleaning | Removes soiling film | 2–5% |
| Battery storage | Shifts surplus to evening, daily | Maximizes self-consumption |
On adjustable ground-mounts, bumping tilt 15° steeper in October and back in April adds a real 5–10% annually — for Louisville (38°N), that's roughly 23° summer tilt and 53° winter tilt. On fixed roofs, the decision was made at install; the remaining levers are shade management and cleaning. One warning we give every customer with trees: a shade survey done in July is half a survey. December's sun path is 40+ degrees lower, and shadows triple in length. If the site has deciduous trees, do the shade math for the solstice, not the sales visit.
Orientation compromises deserve equal honesty. A due-west array isn't a mistake — it shifts production later in the day, which increasingly matches evening-peaking utility rate structures. But west-facing arrays pay for that rate advantage with a 10–20% annual energy penalty and a slightly different seasonal shape: they underperform most in winter mornings, when low sun is weakest. East-west split arrays flatten the daily curve nicely and actually soften the summer-peak/winter-trough ratio a little, because neither face ever sits perpendicular to a high sun. If a salesperson quotes your east-west roof at south-facing numbers, get a second quote.
8A. The Economics: Valuing kWh That Arrive Unevenly

Solar Energy Generation in Summer
Seasonal production isn't just an engineering fact; it's a pricing fact. A July kWh and a December kWh are worth different amounts under most modern rate structures. Under flat-rate net metering they're identical, which is why the policy is so valuable to solar owners. Under time-of-use rates, summer afternoon production is often the most valuable energy the array makes all year — which argues for battery dispatch strategies that harvest exactly those hours. Under avoided-cost or wholesale true-ups, the annual surplus is worth pennies, and the system should be sized to serve load, not to export.
Annual value stack, worked example
Summer Production Characteristics
A 9 kW system in the Ohio Valley produces about 12,000 kWh/year — call it 7,800 kWh in the warm half, 4,200 in the cold half. At a flat $0.15/kWh retail, annual value is $1,800 regardless of timing. Under a TOU rate where summer 2–7 PM power costs $0.24 and winter off-peak costs $0.11, the same physical production can be worth 10–20% more or less depending on when it's consumed versus exported. This is why we model rate structure alongside PSH before quoting savings — the seasonal curve and the rate calendar either cooperate or they don't.
9. How the Swing Hits Your Bill (and Net Metering Fixes It)

Seasonal Bill Impact
| Season | Solar Production | Home Usage | Typical Bill Impact |
|---|---|---|---|
| Summer | High | High (AC) | Net credits possible |
| Fall | Moderate | Low | Surplus credits likely |
| Winter | Low | High (heating) | Grid import needed |
| Spring | Moderate-High | Low | Surplus credits likely |
Net metering is the financial shock absorber: summer surplus becomes credits that winter consumption spends down. This is exactly why systems size to annual kWh, not to any single month. In markets with annual true-ups, the ideal design zeroes out around March or April — credits fully consumed, minimal leftover paid out at wholesale rates. If your utility instead pays avoided-cost for annual surplus, oversizing past ~100% of annual usage stops paying; talk to us before assuming bigger is better.
10. Where Batteries Fit in Seasonal Planning

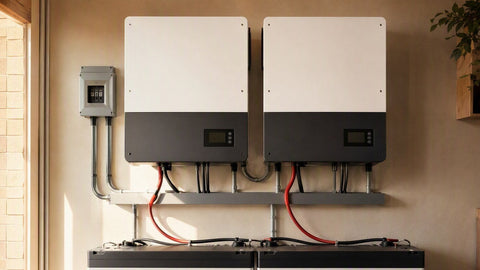
Let's be direct: batteries do not solve seasonal variation. Storing July's surplus for January would take months of capacity — a warehouse of batteries, not a garage wall. What storage does is daily smoothing: capturing the 2 PM surplus and spending it at 8 PM, every day of the year.
Strategies to Maximize Year-Round Output
Conclusion: Planning for Year-Round Solar Success
| Season | Battery Function | Primary Benefit |
|---|---|---|
| Summer | Store midday surplus for evening AC | Avoid peak rates, maximize credits |
| Winter | Capture limited solar for evening/morning | Maximize self-consumption of a smaller harvest |
| Year-round | Backup during outages | Resilience |
Size winter expectations honestly. A 10 kWh battery that cycles full in June may see only 5–7 kWh of daily throughput in December because the array has less to spare. Our battery sizing guide walks the math, and the storage catalog — including the Fortress eFlex Max 5.4kWh and Enphase IQ 5P — covers modular banks you can grow later. Off-grid winter planning is a different discipline entirely: design to the December PSH, not the annual average, and the 4,000-watt system battery math shows why.
11. Off-Grid in Winter: Where Seasonality Bites Hardest

Grid-tie owners experience winter as a bigger bill. Off-grid owners experience it as a generator runtime problem. The design discipline is ruthless: size the array and battery bank to the worst month, not the average. At 2.5 December PSH, an off-grid home using 20 kWh/day needs roughly 20 ÷ (2.5 × 0.80) = 10 kW of array just to break even on average December days — and "average" still leaves the bad weeks. That's why real off-grid designs pair the array with a battery bank sized for 2–3 autonomy days and a backup generator for the stretches weather refuses to cooperate. The Generac PWRcell cost guide and our whole-home generator sizing guide cover the backup half of that pair; the generator catalog covers the hardware.
The winter charge-controller detail matters too: cold batteries accept charge differently, and LiFePO4 banks must not be charged below freezing without heating or BMS protection. An MPPT controller with proper temperature-compensated charging — the Victron SmartSolar 250/100 is a workhorse here — and a heated or indoor-mounted battery bank are the difference between a winter that works and a bank that bricks itself in January. Our battery life guide covers the cold-weather protocols.
12. Verifying Your Own Curve: What Healthy Looks Like
Every owner should learn to read their own monitoring against the seasonal baseline. The quick method: take a clear-sky day, note the kWh produced, and divide by system kW. In June at mid-latitude, a healthy fixed-tilt system prints 4.5–5.5 kWh/kW. In December, 2.0–3.0. A June day at 3.1 kWh/kW or a December day at 0.9 deserves a closer look — soiling, shade, a string fault, or an inverter alarm you haven't opened yet. Modern monitoring platforms do this normalization automatically; the AI-driven stack we cover in our AI and IoT guide exists largely to automate exactly this comparison against weather-adjusted expectations.
One trap to avoid: comparing your app to a neighbor's. Orientation, tilt, shading, and DC/AC ratio move the number more than equipment brand does. Your system's honest benchmark is its own history, season over season.
Everything above scales linearly with watts, but commercial sites add two wrinkles. First, demand charges: a warehouse whose utility bill is dominated by demand peaks cares more about the shape of the summer afternoon curve than annual kWh, and storage dispatch targets the demand meter, not the energy meter. Second, agricultural and ground-mount sites get to choose tilt and row spacing freely — which makes winter design choices (steeper tilt, wider row spacing to avoid inter-row shading at low sun angles) genuinely available. Inter-row shading is invisible in June and brutal in December; a ground-mount laid out with tight summer-optimized rows can lose 15% of winter production to the shadow of its own front rank. Our commercial ground-mount kits and commercial panel lines are spec'd with winter geometry in the racking math, not just summer energy density.
Bifacial modules deserve a final seasonal word: their rear-side gain is highest exactly when production is otherwise lowest — low winter sun over bright, reflective ground cover, especially snow. A bifacial ground-mount over pale gravel or snow can pick up 10–20% winter rear-side gain where a rooftop module gets almost nothing. It's one of the few technologies whose benefit concentrates in the season you need it most. The bifacial category is where those modules live, and the NEC 2026 changes article explains how the newest code cycle finally gives bifacial current calculations their own compliant path.
"Solar doesn't work in winter." It works fine — at roughly half power. Germany and the Northeast run enormous solar fleets at higher latitudes than most of the continental US. Winter output is lower, not zero, and annual economics absorb the trough.
"Cold weather damages panels." Panels are tested to IEC 61215 thermal cycling — dozens of swings from −40°C to +85°C in a chamber. Winter is the kindest season a module sees. What actually hurts equipment is freeze-thaw on bad roof penetrations and ice loading on cheap mounting hardware, which is an installation-quality issue, not a climate issue.
"A bigger inverter fixes winter." Inverter capacity caps the top of the curve; winter lives at the bottom. Oversizing the inverter does nothing in December and wastes money in July. If anything, winter is an argument for the opposite — a healthy DC/AC ratio (1.2–1.3) keeps the inverter operating in its efficient band during low-production months.
"Summer production is what the brochure promised." Brochures quote STC nameplate; summer heat means the array rarely touches it. Judge the system on daily kWh against the PSH formula, not on whether it ever displays the nameplate number.
Key Factors Affecting Seasonal Production
Plan on the 65/35 rule: about 65% of annual production in the warm half of the year, 35% in the cold half. Peak months deliver 2–2.5× the trough months. Cold improves panel efficiency 5–15% and it doesn't matter — sunlight availability dominates everything. Size to the annual number, use net metering as the seasonal battery, and set owner expectations in writing before the first December. The system isn't broken in January. It's solar.
If you take one action from this guide, make it this: pull your monitoring history for the last twelve months and compare your own monthly curve against the table in section 5. If your shape matches, your system is healthy and your expectations can be too. If a month falls well off the curve without a weather explanation, that's the earliest, cheapest diagnostic you'll ever get — and it's free. Everything else in seasonal solar management builds on that habit.
PES Supply stocks the hardware for every season — panels, inverters, bifacial modules that harvest snow albedo, and complete grid-tied systems — 50,000+ SKUs from 169 authorized brands, delivered in 7–10 business days. Get a quote with your address and we'll model your actual monthly curve, not a national average.
Whatever season you're reading this in, the practical takeaway is the same: annual energy is the number that pays the bills, and annual energy is designed, not hoped for. Model with monthly irradiance data, size the inverter for real summer clipping behavior, spec racking tilt for your latitude and load profile, and build the snow and soiling plan into the owner conversation on day one. The systems that delight their owners in February were designed by people who thought about February in June.
Frequently Asked Questions
How much less do solar panels produce in winter vs summer?
How much less do solar panels produce in winter vs summer?
At mid-latitude locations (35°–45°N), expect 40–60% less energy in winter than summer. Peak months (June–July) typically produce more than double the trough months (December–January). Northern latitudes swing harder; southern latitudes swing less.
Do solar panels work on cloudy winter days?
Yes. Overcast conditions typically yield 10–25% of clear-sky output; light clouds allow 50–70%. Even on the gloomiest days the array produces something from diffuse light — just not much.
Are solar panels more efficient in cold weather?
Yes — roughly 0.3–0.5% more efficient per degree Celsius below 25°C cell temperature. A cold, sunny winter day converts light 5–15% more efficiently than a hot summer afternoon. But winter's shorter days and weaker light overwhelm the efficiency gain, so total production still drops 40–60%.
Should I clear snow off my solar panels?
Light snow slides off tilted glass on its own. For heavy accumulation, clear only what you can reach safely from the ground with a soft roof rake. Never climb a snow-covered roof — the recovered December production is small, and the injury risk is not.
What share of annual production comes from summer?
At mid-latitudes, about 65% of annual production occurs from March 21 to September 21. June and July alone account for roughly 20–25% of the yearly total.
How does tilt angle affect seasonal production?
Shallow tilt favors high summer sun; steep tilt favors low winter sun. Fixed systems set near latitude split the difference. Adjustable systems tilted +15° in winter and −15° in summer can add 5–10% annually.
Why do panels produce less on very hot summer days?
Negative temperature coefficient: cell temperatures of 140–160°F on extreme days cut output 10–18% vs. nameplate. A mild clear spring day can out-produce a scorching summer afternoon per sun-hour.
Can batteries store summer energy for winter?
No — seasonal storage would require months of capacity and is uneconomical. Batteries shift energy within a day: summer midday surplus to evening, limited winter harvest to morning and night. Net metering, not batteries, is the practical seasonal balancer.