Solar ROI Calculator: Payback, ITC & 25-Year Savings by State
Reading time: ~10 min read
📋 Key Takeaways
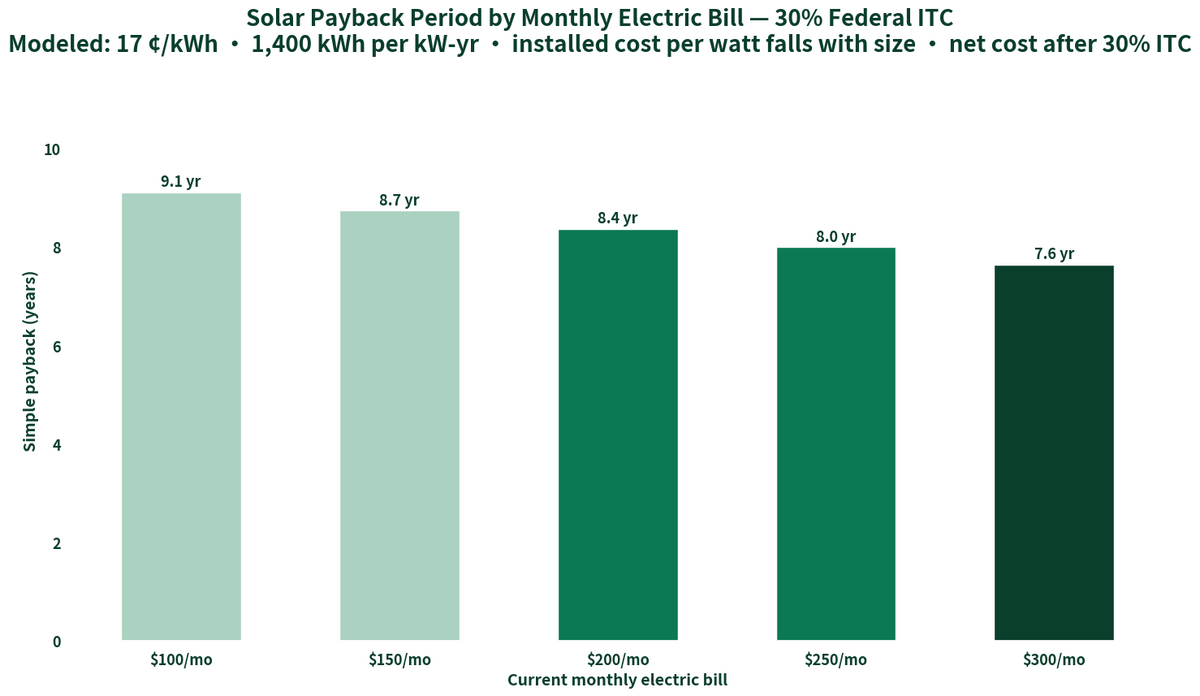
- Typical 2026 residential payback runs 7–11 years after the 30% federal Investment Tax Credit — faster in high-rate states (CA, NY, NJ, CT) even with mediocre sun, slower in cheap-power states (WA, LA, TX) even with great sun.
- Utility rate, not sunshine, is the biggest ROI lever: a 5.2-sun-hour state at $0.14/kWh pays back slower than a 4.2-sun-hour state at $0.22/kWh.
- Every point of utility rate inflation (2% vs 5%) moves 25-year net savings by five figures on a typical 8kW system — run the sensitivity table before quoting a number to a customer.
- Cash purchases deliver the full ROI; loans stretch payback by the interest cost; leases/PPAs hand most of the 25-year value to the third party.
- The 30% ITC applies to the full installed cost including battery storage (3kWh+) — size the quote so the credit lands on the whole job.
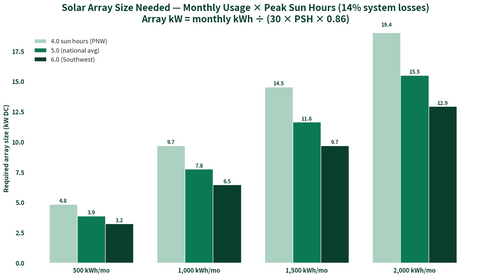
Solar payback math is not complicated, but it is easy to do dishonestly — which is why customers arrive with quotes promising 4-year payback and others swearing solar never pencils. The honest version needs four inputs: what the customer pays per kWh, how much sun the roof gets, what the installed system costs per watt, and what happens to utility rates over 25 years. The calculator below runs that math transparently: enter the monthly bill and state (peak sun hours and the utility rate auto-fill and stay editable), and it returns the system size, cost after the 30% federal Investment Tax Credit, simple payback, and 25-year net savings with your chosen rate-inflation assumption.
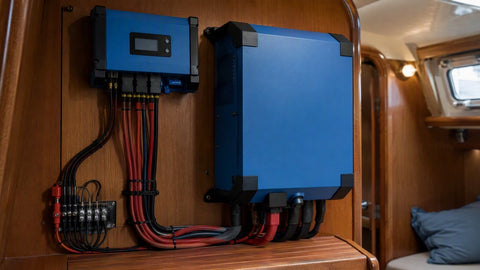
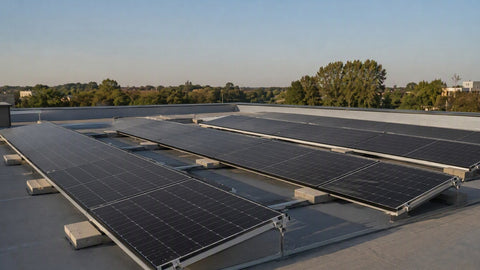
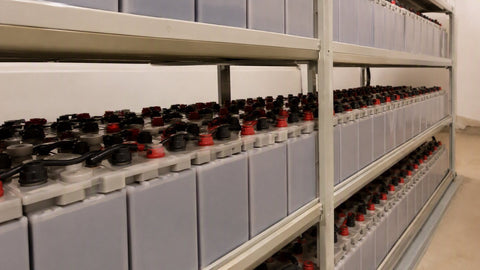
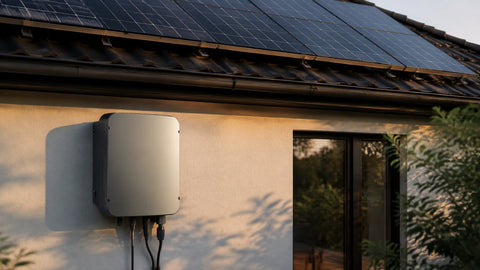
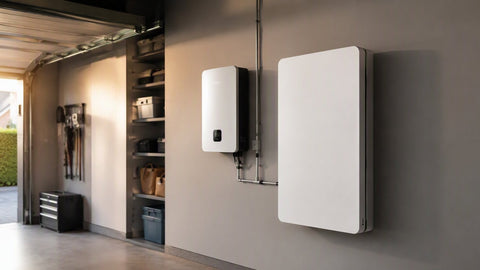
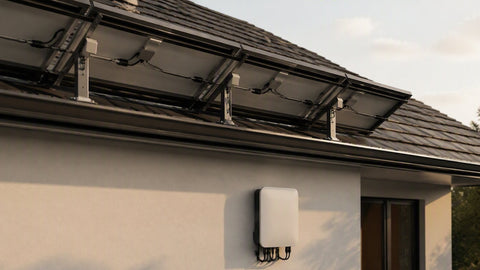
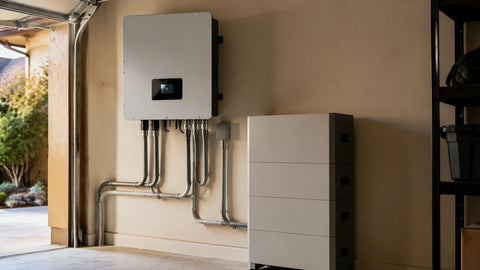
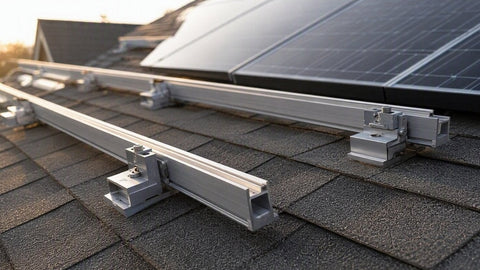
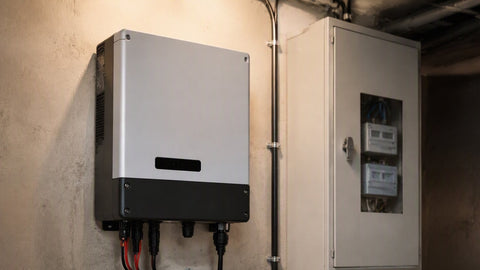
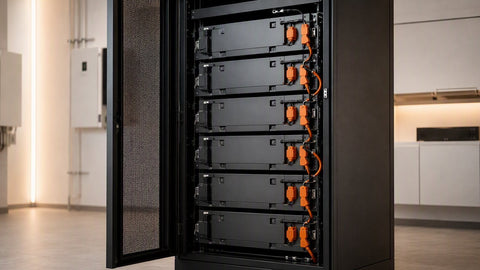
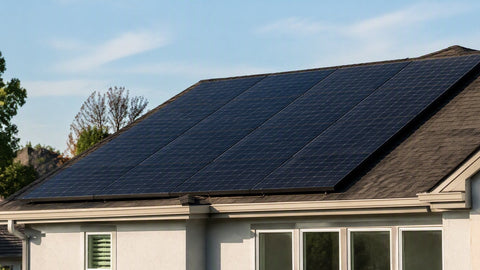
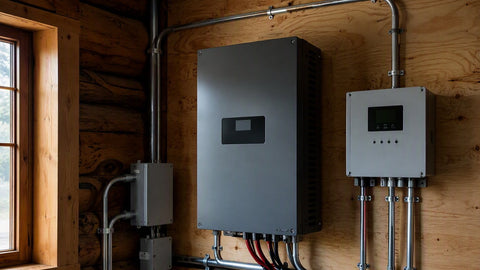
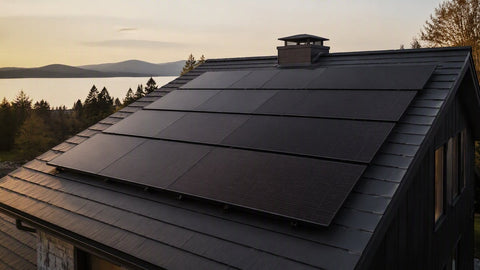
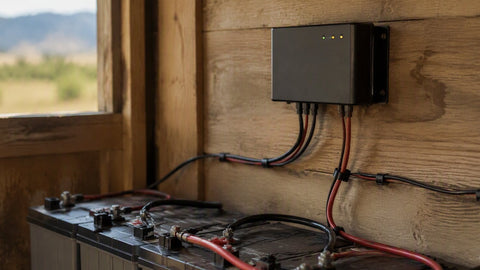
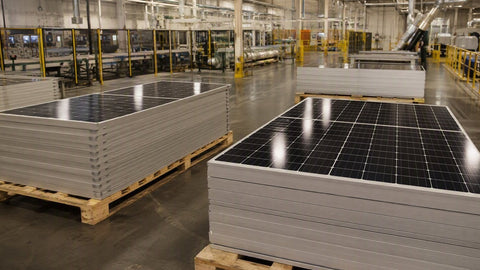
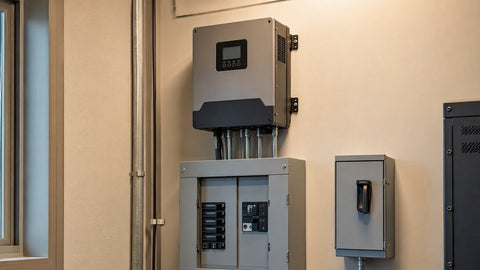
Building a quote? Our solar panels collection stocks modules from 169 authorized brands, inverters covers string and microinverter options, and batteries and storage completes the hybrid package that increasingly drives residential ROI.
Solar Payback & ROI Calculator
Auto-fills sun hours and rate below; both stay editable.
2026 typical: $2.50–3.20/W residential turnkey.
System size (100% offset): —
Cost after 30% ITC: —
Simple payback: —
25-year net savings: —
Assumes 100% usage offset, 78% system derate (soiling, inverter, temperature, wiring), 0.5%/yr panel degradation, and flat net metering at retail. Real billing (TOU, NEM 3.0-style export rates, fixed charges) moves results — treat output as a planning estimate, not a proposal. The 30% federal ITC rate is per current law; confirm eligibility with the customer's tax advisor.
Payback Sensitivity: Why Rate Inflation Is the Quiet Lever
Simple payback divides net cost by year-one savings — it ignores the fact that the utility rate keeps climbing while the solar production cost is frozen at zero. On a national-average job ($180/month bill, 8.8kW system, $17,200 net after ITC), the inflation assumption alone swings the 25-year outcome by more than $10,000:
| Utility rate inflation | Simple payback | 25-year gross savings | 25-year net (after system cost) |
|---|---|---|---|
| 2% — conservative | 8.0 years | ≈$66,000 | ≈$49,000 |
| 3% — historical average | 8.0 years | ≈$75,000 | ≈$58,000 |
| 4% — aggressive | 8.0 years | ≈$86,000 | ≈$69,000 |
| 5% — high-growth territories | 8.0 years | ≈$98,000 | ≈$81,000 |
Note what doesn't move: simple payback. That's why honest proposals show both numbers — payback tells the customer when they're whole; the 25-year figure tells them what the asset is worth. EIA rate history supports roughly 2–3% long-run national residential inflation, with some territories (CA, HI, the Northeast) running materially hotter over the last decade. Quote at 3%, show the 2% floor, and let the customer decide which future they believe.
Rate Beats Sunshine: Reading the State Map
Contractors new to solar assume the Southwest owns the ROI table. It doesn't. Arizona's 6.5 peak sun hours produce a lot of kWh, but at $0.15/kWh each one is cheap. New York's 4.2 sun hours produce fewer, but at $0.22/kWh each one is worth half again as much — and the system costs about the same per watt in both places. The states where residential solar pencils fastest share one trait: expensive grid power. California at $0.31/kWh pays back in 5–7 years despite NEM 3.0 export cuts; Washington's 3.9 sun hours at $0.12/kWh stretches past 13. When a customer asks "is solar worth it here," the answer starts with their rate schedule, not their latitude.
Cash vs. Loan vs. Lease: Who Keeps the 25-Year Value
The calculator above assumes a cash purchase — full ITC to the owner, full savings to the owner. Financing changes who keeps what:
- Cash: fastest payback, full 25-year net. The honest baseline for every quote comparison.
- Solar loan (10–20 yr): the customer keeps the ITC and the savings but pays interest — at typical rates, effective payback stretches 2–4 years and 25-year net drops by roughly the total interest paid. Still ownership, still the ITC, still strong ROI at sub-7% rates.
- Lease / PPA: no ITC to the homeowner (the third party claims it), savings are the spread between the lease payment and the old bill — typically 10–25% off, not the 70–100% long-run value of ownership. Easy to sell, thin for the customer, and escalator clauses can erase the spread entirely by year 15.
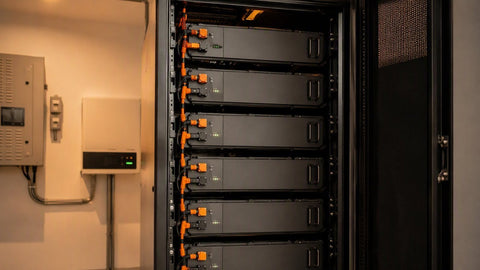
One more ITC detail that changes real quotes: the 30% credit covers the entire installed cost of the solar system, and battery storage of 3kWh or more qualifies even when added to an existing system. Bundling storage into the original job puts the credit on the battery too — and in TOU and weak-export-rate territories, storage is what turns a marginal solar ROI into a good one by shifting production into evening peak rates.
A final quoting reality check: this calculator's 78% derate already absorbs inverter losses, shading tolerance, soiling, and wiring, but it assumes a clean, unshaded roof at a reasonable tilt. Real roofs with vents, chimneys, and tree shade produce less — module-level electronics (microinverters or optimizers) recover much of that loss and are worth their premium on chopped-up roofs, while a simple string inverter on a clean south-facing plane stays the cheapest path to a fast payback. Pull the production estimate from a shade-aware design tool before you promise a customer the number this calculator returns; the finance math is only as honest as the kWh estimate feeding it.
Frequently Asked Questions
What is the average payback period for solar panels in 2026?
After the 30% federal Investment Tax Credit, typical residential payback runs 7–11 years at national-average rates ($0.17/kWh) and installed costs ($2.50–3.20/W). High-rate states like California, New York, and New Jersey see 5–8 years despite moderate sun; cheap-power states like Washington, Louisiana, and parts of Texas stretch to 11–14 years. Systems carry 25-year production warranties, so most of the asset's life is post-payback profit.
How does the 30% solar tax credit (ITC) work?
The federal Investment Tax Credit returns 30% of the total installed system cost — equipment, labor, permits, and qualifying battery storage of 3kWh or more — as a dollar-for-dollar credit against federal income tax. A $25,000 system yields a $7,500 credit. It is a credit, not a deduction, and unused amounts roll forward; the homeowner must own the system (cash or loan — leases and PPAs give the credit to the third party). Confirm current law and eligibility with a tax professional.
Is solar worth it in states with less sunshine?
Often yes — utility rate matters more than sun hours. A state with 4.2 peak sun hours and a $0.22/kWh rate (New York) pays back faster than a state with 6.5 sun hours at $0.15/kWh (Arizona) at equal installed cost. Run the calculator with the actual utility rate and local $/W quotes; anything under ~10-year simple payback with 25-year equipment warranties is a strong investment.
How much does utility rate inflation change solar ROI?
Substantially over 25 years. On a typical 8–9kW system, moving the rate-inflation assumption from 2% to 5% swings cumulative savings by roughly $30,000, because the solar kWh price is frozen at zero while the grid price compounds. Simple payback does not change — it only counts year-one savings — which is why proposals should show both payback and an inflation-sensitivity range. Long-run national residential rate inflation has averaged roughly 2–3%.
Does adding battery storage improve solar ROI?
It depends on the rate structure. Under flat net metering at full retail, storage adds cost with little return. Under time-of-use billing or reduced export rates (California NEM 3.0-style), storage shifts solar production into high-value evening hours and can materially improve ROI — and batteries of 3kWh+ qualify for the 30% ITC even when retrofitted. Storage also delivers backup value that pure ROI math ignores; many customers buy it for resilience first.
Quoting a Residential Solar Job?
PES Supply stocks panels, inverters, racking, and battery storage from 169 authorized brands. Send the load profile and roof layout — we'll quote the complete BOM at contractor pricing.
Shop Solar Panels Contact Us for Bulk PricingRelated Resources
- Solar panels and modules
- String and microinverters
- Battery storage and hybrid systems
- Electrical supplies for interconnection