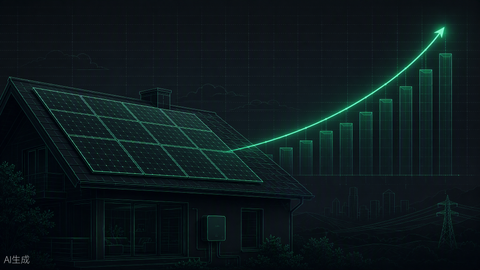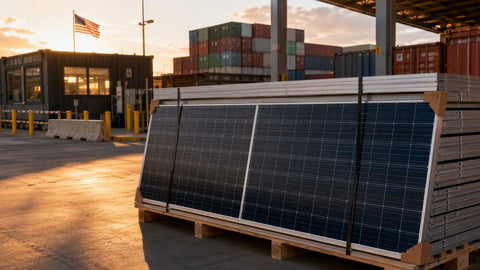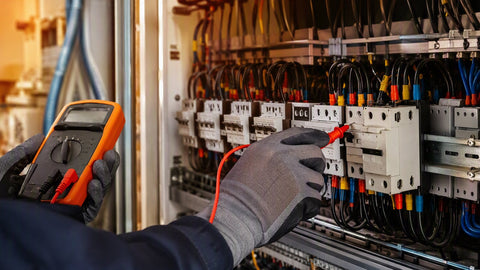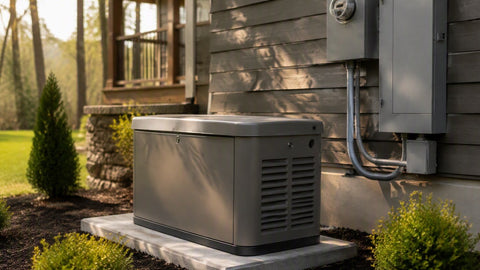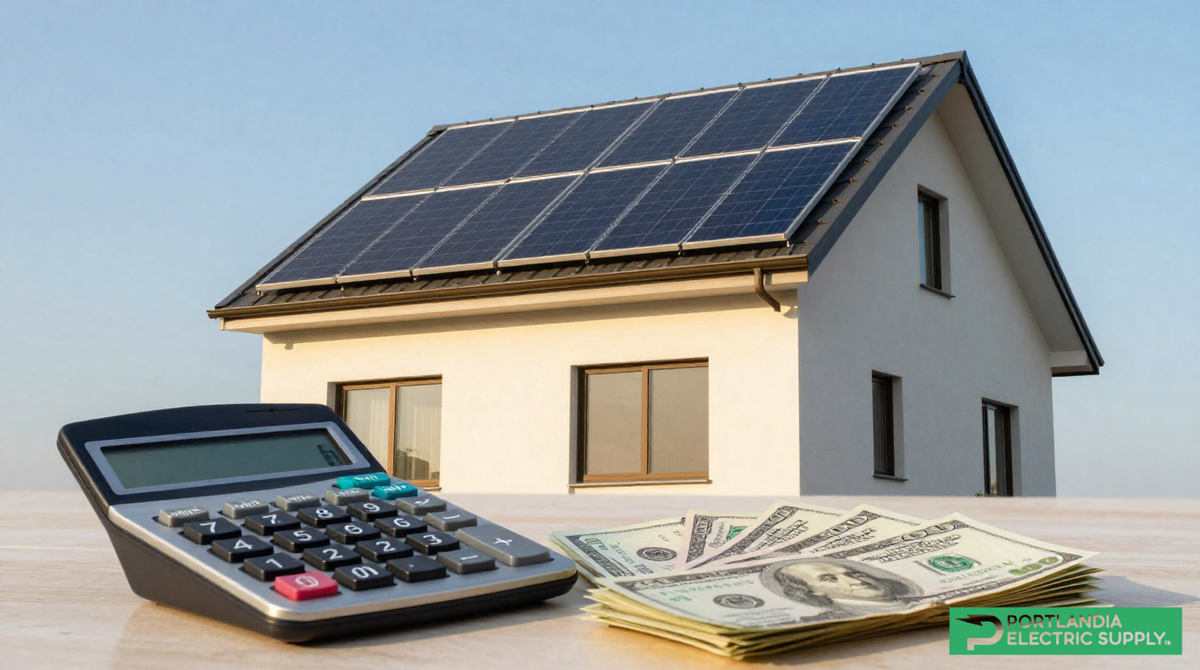
"How much does solar energy cost?" It's the first question nearly every homeowner asks—and for good reason. Understanding pricing is the crucial first step toward making an informed decision about going solar. At PES Supply, we believe in complete transparency For solar costs.
In this comprehensive guide, we'll break down exactly what you can expect to pay for a solar energy system in 2026, what factors affect pricing, available incentives that reduce your out-of-pocket expense, and most importantly—how much you'll save in the long run. Whether you're a homeowner exploring rooftop solar or a business owner considering a commercial installation, this guide covers everything you need to know about solar energy costs.
💰 Key Takeaways
- Average Cost: Residential solar systems cost $15,000–$25,000 before incentives, or $10,500–$17,500 after the 30% federal tax credit
- Cost Per Watt: $2.50–$3.50 before incentives, dropping to $1.75–$2.45 after federal tax credit
- Payback Period: Most homeowners recoup their investment in 6–10 years, then enjoy 15–20+ years of essentially free electricity
- Federal Tax Credit: The 30% ITC is available through 2032, then steps down to 26% (2033) and 22% (2034)
- 25-Year Savings: A typical 8 kW system can save homeowners $45,000+ over its lifetime after payback
In This Guide:
- Solar Energy Cost: The Quick Answer
- Solar Panel Cost by System Size
- What's Included in Solar Energy Cost?
- Tax Credits & Incentives That Reduce Your Cost
- Factors That Affect Your Solar Energy Cost
- Solar Financing Options: How to Pay for Solar
- Solar ROI: How Long Until Solar Pays for Itself?
- Commercial Solar Energy Costs
- Frequently Asked Questions
Solar Energy Cost: The Quick Answer
Let's cut straight to the numbers. In 2026, the average cost of a residential solar panel system in the United States falls within a predictable range based on system size and equipment quality. Here's what you can expect to pay:
| Cost Metric | Before Tax Credits | After 30% Tax Credit |
|---|---|---|
| Average System (6-8 kW) | $15,000 – $25,000 | $10,500 – $17,500 |
| Cost Per Watt | $2.50 – $3.50 | $1.75 – $2.45 |
| Cost Per kWh (Lifetime) | $0.06 – $0.08 | $0.04 – $0.06 |
These figures represent national averages for a turnkey residential installation including equipment, labor, permits, and standard warranties. Your actual cost may be higher or lower depending on your location, roof complexity, equipment choices, and available state and local incentives beyond the federal tax credit.
Understanding Cost Per Watt
Cost per watt ($/W) is the standard metric for comparing solar pricing. To calculate your estimated system cost, multiply the cost per watt by your system size in watts. For example: $3.00/W × 7,000W (7 kW system) = $21,000 before incentives. This metric allows you to compare quotes on an apples-to-apples basis regardless of system size.
Solar Panel Cost by System Size
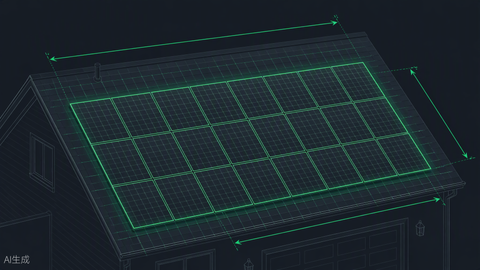
The size of your solar system is the single biggest factor determining cost. Larger systems cost more in absolute terms but typically have a lower cost-per-watt due to economies of scale—an 8 kW system doesn't cost twice as much as a 4 kW system. Here's a detailed breakdown:
Residential Solar System Costs by Size
| System Size | Cost Before Credits | Cost After 30% Credit | Best For |
|---|---|---|---|
| 4 kW | $10,000 – $14,000 | $7,000 – $9,800 | Small homes, condos, low energy usage |
| 6 kW | $15,000 – $21,000 | $10,500 – $14,700 | Average homes, moderate energy usage |
| 8 kW | $20,000 – $28,000 | $14,000 – $19,600 | Larger homes, higher energy usage (most popular) |
| 10 kW | $25,000 – $35,000 | $17,500 – $24,500 | Large homes, EV owners, pools/hot tubs |
| 12+ kW | $30,000 – $42,000+ | $21,000 – $29,400+ | Very large homes, small businesses, high consumption |
💡 Pro Tip: Right-Sizing Your System
The goal is matching your system size to your actual electricity consumption—not the biggest system that fits on your roof. Review 12 months of utility bills to determine your annual kWh usage, then size your system to offset 80-100% of that consumption. Oversizing wastes money; undersizing leaves savings on the table.
How to Determine the Right System Size
| Annual Usage (kWh) | Recommended System Size | Estimated Panel Count |
|---|---|---|
| 4,000 – 6,000 kWh | 3 – 5 kW | 8 – 12 panels |
| 6,000 – 9,000 kWh | 5 – 7 kW | 12 – 18 panels |
| 9,000 – 12,000 kWh | 7 – 10 kW | 18 – 25 panels |
| 12,000 – 18,000 kWh | 10 – 14 kW | 25 – 35 panels |
| 18,000+ kWh | 14+ kW | 35+ panels |
What's Included in Solar Energy Cost?
When you receive a quote for a solar installation, the total cost includes several components. Understanding this breakdown helps you evaluate quotes and identify where you might find savings or where cutting corners could hurt long-term performance.
Solar Installation Cost Components
| Component | % of Total | What It Covers |
|---|---|---|
| Solar Panels | 25–30% | Photovoltaic modules that capture sunlight and generate DC electricity |
| Inverter(s) | 10–15% | Converts DC power to AC power for home use and grid connection |
| Mounting & Racking | 10% | Aluminum rails, clamps, and hardware securing panels to roof |
| Labor & Installation | 15–20% | Professional installation by certified technicians |
| Permits & Inspections | 5–10% | Building permits, utility interconnection, electrical inspections |
| Wiring & Electrical | 5–10% | Cables, conduit, disconnects, monitoring systems |
| Overhead & Warranty | 10–15% | Company operations, warranties, customer support, insurance |
Hardware vs. Soft Costs
About 55-65% of your solar cost is "hard costs"—the actual equipment (panels, inverters, racking, wiring). The remaining 35-45% are "soft costs"—labor, permits, overhead, and customer acquisition. Soft costs have been slower to decline than hardware costs, which is why buying quality equipment from PES Supply and working with efficient installers can deliver significant savings.
Tax Credits & Incentives That Reduce Your Cost
One of the biggest advantages of going solar in 2026 is the generous incentives available. The federal tax credit alone reduces your cost by 30%—but depending on where you live, additional state and local incentives can push your savings even higher.
Federal Investment Tax Credit (ITC) — 30%
The federal solar Investment Tax Credit allows you to deduct 30% of your total solar installation cost from your federal income taxes. This is a dollar-for-dollar reduction in your tax liability—not just a deduction from taxable income. It's one of the most valuable incentives available.
Federal Tax Credit Example:
- Total System Cost: $20,000
- 30% Tax Credit: $6,000
- Your Effective Cost: $14,000
- Savings: $6,000 off your federal tax bill
Federal Tax Credit Timeline
| Installation Year | Tax Credit Percentage | Credit on $20,000 System |
|---|---|---|
| 2022 – 2032 | 30% | $6,000 |
| 2033 | 26% | $5,200 |
| 2034 | 22% | $4,400 |
| 2035+ | 0% (residential) | $0 |
⚠️ Important Tax Credit Requirements
The tax credit is non-refundable, meaning you must owe at least as much in federal taxes as the credit amount to receive the full benefit. If your tax liability is less than your credit, you can carry the unused portion forward to future tax years. Always consult a tax professional for advice specific to your situation.
State & Local Incentives
Depending on where you live, additional incentives may be available that stack on top of the federal tax credit:
| Incentive Type | Description | Typical Value |
|---|---|---|
| State Tax Credits | Additional tax credits at the state level | $1,000 – $5,000+ (varies by state) |
| Rebate Programs | Upfront cash rebates from utilities or state programs | $500 – $3,000+ |
| Property Tax Exemptions | Solar doesn't increase your property taxes | $400 – $600/year in avoided taxes |
| Sales Tax Exemptions | No sales tax on solar equipment purchases | 5 – 10% savings |
| SRECs | Sell Solar Renewable Energy Credits for income | $20 – $400+ per SREC (varies widely) |
| Net Metering | Credits for excess energy sent to grid | Ongoing bill savings |
💡 Pro Tip: Check the DSIRE Database
The Database of State Incentives for Renewables & Efficiency (DSIRE) at dsireusa.org provides a comprehensive, up-to-date listing of all solar incentives available in your state. Many homeowners are surprised to discover additional rebates and credits they didn't know existed.
Factors That Affect Your Solar Energy Cost
Your actual solar cost may be higher or lower than averages based on several factors specific to your home, location, and equipment choices. Understanding these variables helps you anticipate what might affect your quote.
Key Cost Factors Explained
| Factor | Impact on Cost | What to Know |
|---|---|---|
| System Size | Largest factor | Larger systems cost more total but less per watt. An 8 kW system typically costs 75-85% more than 4 kW, not double. |
| Panel Quality/Brand | +/- 15-25% | Premium panels (higher efficiency, longer warranties) cost more but produce more power per square foot over time. |
| Roof Complexity | +5-15% | Multiple roof planes, steep pitches, skylights, or obstacles increase labor time and complexity. |
| Roof Condition | +$5,000-$15,000 | If your roof needs replacement, it's best to do so before solar installation. Some projects bundle both. |
| Electrical Upgrades | +$1,000-$3,000 | Older homes may need electrical panel upgrades (100A to 200A) to accommodate solar. |
| Battery Storage | +$10,000-$20,000 | Adding battery backup provides energy independence but significantly increases upfront cost. |
| Location | +/- 10-20% | Labor rates, permit costs, and regulations vary by region. Urban areas typically cost more than rural. |
The Battery Decision
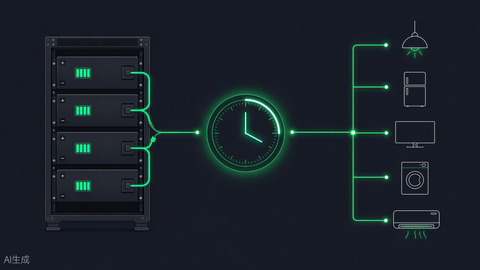
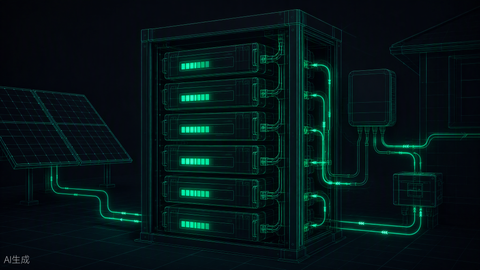
Battery storage adds significant cost but provides backup power during outages and maximizes self-consumption of your solar energy. For most grid-tied homeowners, batteries aren't essential for savings—net metering handles excess production. However, if you experience frequent outages, have time-of-use rates, or want energy independence, batteries can be a worthwhile addition. Explore battery options.
Solar Financing Options: How to Pay for Solar
Don't have $15,000-$25,000 available for a cash purchase? No problem. Most homeowners use financing to go solar, and multiple options exist to fit different financial situations. Each has distinct advantages and trade-offs.
Solar Financing Comparison
| Option | Pros | Cons |
|---|---|---|
| Cash Purchase | Best ROI, you own system outright, all incentives are yours, no interest payments | High upfront cost, ties up capital |
| Solar Loan | $0 down options, you own system, keep tax credits, immediate savings possible | Interest adds to total cost, monthly payments, credit requirements |
| Solar Lease | $0 down, no maintenance worries, predictable monthly payments | Don't own system, no tax credits, less savings overall, complicates home sale |
| PPA (Power Purchase Agreement) | $0 down, pay only for power used, often lower than utility rates | Don't own system, no tax credits, possible rate escalation clauses |
| HELOC | Low interest rates, potentially tax-deductible interest, flexible terms | Uses home as collateral, variable rates possible, requires home equity |
💡 Pro Tip: Ownership vs. Third-Party
Cash purchases and solar loans mean you own the system and receive all incentives—typically delivering 40-70% greater lifetime savings than leases or PPAs. However, leases and PPAs offer simplicity and $0 down with no credit requirements. If you have good credit and sufficient tax liability, owning your system usually provides the best financial outcome.
Financing Impact on Total Cost
| Scenario | System Cost | Interest/Fees | Total Paid | 25-Year Net Savings |
|---|---|---|---|---|
| Cash (after ITC) | $16,800 | $0 | $16,800 | ~$48,000+ |
| Solar Loan (6%, 15yr) | $16,800 | ~$8,500 | ~$25,300 | ~$39,500+ |
| Solar Lease | $0 down | N/A | ~$32,000-$40,000 | ~$20,000-$25,000 |
Solar ROI: How Long Until Solar Pays for Itself?
The payback period—how long it takes for your energy savings to equal your investment—is typically 6-10 years for most homeowners. After that, you're generating essentially free electricity for another 15-20+ years (solar panels typically last 25-30+ years with warranties to match).
Sample ROI Calculation
Example: Typical Homeowner ROI
| System Size | 8 kW |
| Total Cost (Before Credits) | $24,000 |
| After 30% Federal Tax Credit | $16,800 |
| Annual Energy Production | ~9,000 kWh |
| Electricity Rate | $0.20/kWh |
| Annual Savings (Year 1) | ~$1,800 |
| Payback Period | ~9.3 years |
| 25-Year Net Savings | $45,000+ |
*Assumes 3% annual utility rate increase and 0.5% annual panel degradation. Actual results vary by location and usage patterns.
What Affects Your Payback Period?
| Factor | Effect on Payback |
|---|---|
| Higher electricity rates | Shorter payback — you save more per kWh produced |
| More sunlight (Southwest vs. Northwest) | Shorter payback — panels produce more energy |
| Additional state/local incentives | Shorter payback — lower net cost |
| Financing with interest | Longer payback — interest adds to total cost |
| Shading or suboptimal orientation | Longer payback — reduced energy production |
| Rising utility rates | Accelerates payback over time — your savings grow each year |
Commercial Solar Energy Costs
Commercial and industrial solar projects operate at a different scale than residential installations, with different cost structures and incentive opportunities. Businesses typically benefit from lower cost-per-watt due to economies of scale, plus additional tax benefits like accelerated depreciation.
Commercial Solar Cost Overview
| System Size | Cost Per Watt | Typical Total Cost | Best For |
|---|---|---|---|
| 25-50 kW | $2.20 – $2.80 | $55,000 – $140,000 | Small businesses, retail stores |
| 50-100 kW | $1.90 – $2.40 | $95,000 – $240,000 | Medium businesses, warehouses |
| 100-500 kW | $1.50 – $2.00 | $150,000 – $1,000,000 | Large facilities, industrial |
| 500+ kW | $1.20 – $1.70 | $600,000+ | Manufacturing, large commercial |
💡 Pro Tip: Commercial Tax Benefits
Commercial solar installations qualify for the 30% federal ITC plus MACRS accelerated depreciation, which allows businesses to depreciate solar equipment over 5 years. Combined, these incentives can reduce the effective cost of commercial solar by 50-60%. Consult with a tax professional to maximize your business's solar tax benefits.
Get Your Personalized Solar Cost Estimate
Every home and business is different. The best way to understand your true solar energy cost is with a personalized assessment. At PES Supply, we provide transparent pricing on premium solar equipment—no hidden costs, no pressure.
Get a Free Quote Browse Solar PanelsNotes from the field. I've quoted hundreds of residential systems, and the homeowners who are happiest five years later are the ones who priced the system per watt and per kWh — not per monthly payment. We installed a 9.6 kW system last spring whose owner compared four bids on $/W and saved $3,100 against the highest quote for identical equipment. I've also watched low-ball bids win on price and lose on execution: one crew left a roof with 14 unsealed penetrations, and the "cheapest" system in the neighborhood became the most expensive after the leak repair. Price the equipment and the workmanship separately, always.
Frequently Asked Questions About Solar Energy Cost
Why do solar quotes vary so much between companies?
Solar quotes vary based on several factors: equipment quality and brand (premium panels cost more), warranty terms and coverage, company overhead and marketing costs, sales commissions, and installation complexity assessments. Always compare equipment specifications and warranty terms—not just price. The cheapest quote often uses lower-quality panels that produce less energy over time, resulting in lower lifetime savings despite the lower upfront cost.
Is solar worth the cost if I plan to move in a few years?
Studies consistently show that solar panels increase home values by 3-4% on average, and homes with solar sell faster than comparable homes without. You may recoup your investment through the higher sale price. However, if you're planning to move within 2-3 years, the transaction timing may be tight. In such cases, a solar lease or PPA (which can be transferred to the new owner) might be more appropriate than purchasing.
Are there hidden costs I should know about?
Reputable installers include all costs in their quotes. However, potential additional expenses to watch for include: tree removal if shading is an issue ($500-$2,000+), roof repairs or replacement if needed ($5,000-$15,000), electrical panel upgrades for older homes ($1,000-$3,000), HOA review or approval fees, and trenching for ground-mounted systems. At PES Supply, we believe in fully transparent pricing—always ask for an itemized quote that specifies what's included.
Should I wait for solar prices to drop further?
While solar equipment costs have decreased historically, the rate of decline has slowed significantly as the technology matures. More importantly, the 30% federal tax credit is locked in only through 2032—after which it drops to 26% (2033), 22% (2034), and expires for residential in 2035. Meanwhile, utility rates continue rising 3-5% annually. Each year you wait, you lose a year of savings. For most homeowners, the optimal time to go solar is now—you start saving immediately while maximizing available incentives.
What's the cost difference between premium and budget solar panels?
Premium solar panels typically cost 15-25% more than budget options but offer higher efficiency (producing more power per square foot), lower degradation rates (maintaining output longer), better warranties (25-30 years vs. 12-15 years), and superior performance in challenging conditions. For most homeowners, premium panels deliver better lifetime value—the extra upfront cost is typically recovered through higher energy production and longer lifespan. This is especially true for homes with limited roof space.
Does adding battery storage affect solar cost and ROI?
Yes, battery storage adds $10,000-$20,000 to your solar installation cost (for systems like Tesla Powerwall, Enphase IQ, or similar). This extends the payback period by 3-5+ years. However, batteries provide backup power during outages, maximize self-consumption of your solar energy, and can help avoid peak time-of-use utility rates in some areas. The 30% federal tax credit applies to batteries installed with solar, improving the economics. For homeowners who experience frequent outages or have time-of-use rates, batteries can be worthwhile despite the longer payback.
How much can I save with solar over 25 years?
Lifetime savings vary by location, system size, and electricity rates, but typical homeowners save $25,000-$75,000 over a 25-year system lifetime. Homes with high electricity usage in areas with expensive utility rates (California, Hawaii, Northeast) see the highest savings—sometimes exceeding $100,000. Even in areas with moderate electricity rates, most solar installations deliver $35,000-$50,000 in net savings after accounting for the initial investment and any financing costs.
What ongoing costs should I expect after installation?
Solar panels require minimal maintenance and have no fuel costs. Typical ongoing costs include: occasional cleaning ($100-$200/year if not DIY, though rain often handles this), monitoring subscription fees ($0-$10/month, many systems include free monitoring), potential inverter replacement after 10-15 years ($1,000-$2,500, though many have 25-year warranties now), and insurance rider additions ($10-$25/year increase in homeowner's insurance). Most of these costs are optional or covered by warranties, making solar one of the lowest-maintenance home improvements available.
The Bottom Line on Solar Energy Cost
Solar energy represents one of the best investments homeowners can make in 2026. With system costs averaging $15,000-$25,000 before incentives—and dropping to $10,500-$17,500 after the 30% federal tax credit—solar is more accessible than ever. Most homeowners achieve payback in 6-10 years and enjoy 15-20+ additional years of essentially free electricity, resulting in lifetime savings of $40,000-$75,000 or more.
The key to maximizing your solar investment is working with quality equipment from reputable sources, understanding your financing options, and taking advantage of available incentives before they step down. Whether you pay cash or finance your system, solar delivers strong returns while reducing your carbon footprint and providing energy independence.
Summary: Solar Energy Cost in 2026
Average system (6-8 kW): $15,000-$25,000 before credits, $10,500-$17,500 after 30% ITC. Payback period: 6-10 years. 25-year savings: $40,000-$75,000+. Best time to go solar: Now—while the 30% federal tax credit is available and utility rates continue rising.
About PES Supply
PES Supply is a nationwide electrical supply distributor offering premium Tier 1 solar panels, inverters, standby generators, and related electrical equipment. We provide transparent pricing on quality solar equipment—helping homeowners and businesses make informed decisions about their energy investments.
📍 Location: 1507 Portland Ave, Louisville, KY, United States 📞 Phone: +1 888-876-0007 🌐 Website: www.portlandiaelectric.supply
Article: Solar Energy Cost in 2026: The Complete Pricing Guide for Homeowners & Businesses
Category: Solar Energy / Costs & Financing
Last Updated: February 2026
Related Articles: How Does Solar Energy Work? | Solar Panel Buying Guide | Federal Solar Tax Credit Guide
Related Resources:
- Best Solar Panels 2026 — Buyer's Guide
- EG4 vs Tesla Powerwall
- Qcells vs Trina vs JA
- Solar Inverter Buyer's Guide
- Solar Battery Buyer's Guide
- 5kW Solar Kit
- 10kW Solar + Battery Kit
- Off-Grid Cabin Kit
- EG4 Batteries
- Qcells Solar Panels
- Trina Solar
- JA Solar
- REC Solar
- Mission Solar
- Sol-Ark Inverters
- SolarEdge Inverters
- Generac PWRcell
Calculate how much storage you need with our battery sizing calculator.
Check solar incentives available in your state.
Use our free solar system calculator to size your array.
Check out our Solar Panel Comparison Tool. Check out our Inverter Sizing Calculator.
Calculate your solar payback and 25-year savings with our Solar ROI Calculator. Follow our complete DIY solar installation guide for step-by-step instructions. Keep your system running at peak performance with our Solar Maintenance Guide.
Related Products


Related Resources
- Solar System Calculator
- Battery Sizing Calculator
- Solar Panel Comparison Tool
- Inverter Sizing Calculator
- Solar ROI Calculator
- Solar Installation Guide
- Solar Maintenance Guide
- Solar Permitting Guide
- Battery Installation Guide
- NEC Code Compliance Guide
- Solar Panel Mounting Guide
- Grounding & Bonding Guide
- Solar Incentives by State
- Pro Account — Wholesale Pricing
- PowerLink Network — Contractor Program