Solar Payback & 25-Year Savings Calculator
Net cost ÷ year-1 savings · rate escalation + panel degradation compounded · LCOE over the analysis period
Simple payback = net cost ÷ year-1 savings. Cumulative savings compound rate escalation and panel degradation annually over 25 years. Excludes O&M, inverter replacement, insurance, and financing costs — cash-purchase basis. Enter the incentive percentage that actually applies to your project (state/utility/commercial programs), or 0% to be conservative.
"When does solar pay for itself?" is the only question that survives every sales pitch, and it has a refreshingly honest answer: net system cost divided by annual bill savings. Everything else — escalation, degradation, incentives, financing — is refinement of that one division. The calculator above runs both levels: the simple payback you can check on a napkin, and the compounded 25-year picture that shows what the system is actually worth. Enter your real numbers — an actual quote, your actual utility rate, a realistic production estimate — and the output is a payback period and lifetime net gain you can defend. For sizing the system itself first, start with the solar system size calculator, then come back here with its kWh figure.
The Payback Formula, Dissected
| Component | Where it comes from | Typical 2026 range | Get it wrong and… |
|---|---|---|---|
| Gross system cost | Installed quote: equipment + labor + permitting + interconnection | $2.50–$3.50/W residential | Using equipment-only cost understates payback by years |
| Incentives | State rebates, utility programs, commercial credits — whatever actually applies to your project | 0–30%+ | Assuming a credit you do not qualify for is the classic sales trick |
| Annual production | System kW × peak sun hours × 365 × system efficiency (~0.80) | 1,200–1,800 kWh per kW/yr | Using nameplate DC watts instead of delivered AC kWh inflates savings ~20% |
| Electric rate | Your bill: total $ ÷ total kWh, including riders and fees | $0.11–$0.34/kWh by state | Using the generation-only line of the bill understates savings |
The formula: Payback (years) = (Gross cost − Incentives) ÷ (Annual kWh × Rate). A $20,000 system with $6,000 in applicable incentives producing 10,000 kWh against a $0.16/kWh rate: $14,000 ÷ $1,600 = 8.75 years. That is the number every other claim should be measured against.
Worked Examples — Check the Calculator
| Scenario | Gross cost | Incentive | Net cost | Annual production | Rate | Year-1 savings | Simple payback |
|---|---|---|---|---|---|---|---|
| Mid-size residential, incentives apply | $20,000 | 30% | $14,000 | 10,000 kWh | $0.16 | $1,600 | 8.8 years |
| Small system, no incentives | $15,000 | 0% | $15,000 | 8,000 kWh | $0.12 | $960 | 15.6 years |
| Large system, high-rate state | $30,000 | 30% | $21,000 | 14,000 kWh | $0.22 | $3,080 | 6.8 years |
The spread — 6.8 to 15.6 years — is driven less by panel price than by your utility rate. Solar in a $0.12/kWh market is a patience play; the same hardware at $0.22/kWh is a sprint. This is why "is solar worth it" has no national answer, only a per-bill answer. If you do not know your true all-in rate, how to calculate power consumption walks through reading the bill.
What Moves Payback the Most (Sensitivity Ranking)
Before negotiating panel brands, know which dial actually moves your number. Holding the mid-size example ($20,000 gross, 10,000 kWh/yr, $0.16/kWh) constant:
- Installed price: every $1,000 off the quote moves payback ~0.6 of a year. Three quotes beat one negotiation.
- Utility rate: every $0.01/kWh moves payback ~0.6 of a year — and you cannot negotiate it, only escape it.
- Production: every 500 kWh/yr (about 3% of system size) moves payback ~0.3 of a year. Shade management and orientation live here.
- Incentives: every 5% of cost moves payback ~0.55 of a year. Real, documented incentives only.
- Degradation and escalation: almost irrelevant to the payback figure itself; they shape the 25-year tail, not the break-even.
The practical read: price discipline and shade engineering do more for your payback than a premium panel with a +1% efficiency spec. Buy the boring-reliable module at the better $/W, spend the difference on a good installer, and let the rate do the compounding.
Self-Consumption vs. Net Metering: The Rate You Actually Earn
Everything above assumes each kWh your system makes is worth your full retail rate — true under traditional 1:1 net metering. Under net-billing or avoided-cost regimes (increasingly common since California's NEM 3.0 shift), exported kWh may earn $0.03–$0.08 instead of retail. That splits your production into two values: the kWh you consume on-site at full retail, and the kWh you export at the lower rate. A 50% self-consumption home on avoided-cost exports sees a blended value well below retail — and payback stretches accordingly. The fix is load shifting (run the dishwasher at noon), a bigger daytime load like an EV, or storage. If your utility is on net billing, run the calculator twice — retail for the self-consumed share, export rate for the rest — and sum the savings. It is the difference between a brochure payback and a bankable one.
Estimating Your Production: kWh per kW by Region
Production is system size (kW DC) × peak sun hours × 365 × system efficiency. Use 0.75–0.80 for the efficiency factor (inverter, temperature, soiling, wiring losses). A 10 kW system in a 5.0-sun-hour region: 10 × 5.0 × 365 × 0.78 ≈ 14,200 kWh/yr.
| Region | Avg peak sun hours | kWh/yr per kW installed | 10 kW system yields |
|---|---|---|---|
| Southwest (AZ, NV, NM, SoCal) | 5.5–6.5 | 1,600–1,850 | 16,000–18,500 kWh |
| Texas / Southeast | 4.5–5.5 | 1,350–1,600 | 13,500–16,000 kWh |
| Mid-Atlantic / Midwest | 4.0–4.5 | 1,200–1,350 | 12,000–13,500 kWh |
| Pacific Northwest / Northeast | 3.5–4.0 | 1,050–1,200 | 10,500–12,000 kWh |
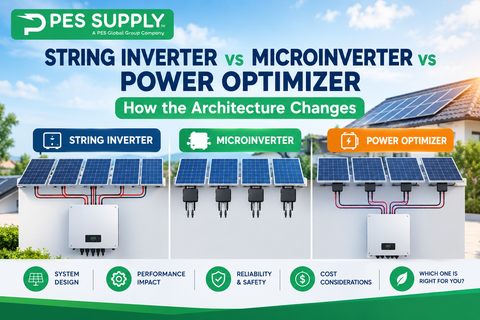
Roof orientation, tilt, and shade move these numbers 10–25%. South-facing at latitude tilt is the reference; east/west arrays cost roughly 15% of production, and partial shade on a string inverter can cost far more than the shade's footprint — one reason microinverters earn their premium on complicated roofs. Our 2026 panel roundup compares the modules by efficiency and warranty.
Why 25-Year Savings Exceed "Payback × Savings" — Escalation
Simple payback freezes the utility rate. Utilities do not. Retail electricity has escalated roughly 2–4% annually over the long run, which means year-15 savings are substantially larger than year-1 savings. Compounded, that turns an 8.8-year payback into a much larger lifetime return:
| Scenario ($20,000 gross, 30% incentive, 10,000 kWh/yr, $0.16 start) | 0% escalation | 3% escalation | 5% escalation |
|---|---|---|---|
| 25-yr cumulative savings (0.5%/yr degradation) | $37,700 | $54,500 | $71,100 |
| 25-yr net gain over $14,000 net cost | $23,700 | $40,500 | $57,100 |
| Effective LCOE | $0.059/kWh — versus a utility rate compounding upward | ||
Degradation works the other direction but gently: modern mono panels degrade about 0.4–0.6% per year, so a system still produces ~88% of its year-1 output in year 25. Both effects are compounded annually in the calculator — the cumulative figure is honest arithmetic, not brochure math. One more quiet assumption worth naming: the model holds your consumption flat. If you are planning an EV, a heat pump, or a pool in the next few years, your future self-consumption rises and the effective value of every solar kWh rises with it — size the array for the house you are building toward, not just last year's bills. Commercial projects play by bigger rules; see commercial solar installation costs for that cost structure.
Cash vs. Loan vs. Lease — How Financing Changes the Answer
The calculator assumes cash. A solar loan at 6–8% APR adds finance cost that typically stretches payback by 2–4 years but preserves ownership of the incentives and the asset. Leases and PPAs invert the model: zero down, immediate bill reduction of 10–30%, but the third party owns the incentives and the escalator clause (often 1–3%/yr) eats the savings you were counting on from utility escalation. If the lease escalator matches your utility's escalation, your savings never grow. Always compare a lease's year-20 payment against the year-20 utility rate, not today's.
The 2026 Incentive Landscape: Be Honest With the Input
Residential federal tax credit eligibility changed after 2025, and what applies to your project depends on placed-in-service dates, state programs, utility rebates, and whether the project qualifies under remaining commercial provisions. Our advice: run the calculator twice — once at 0% incentive and once at your best-documented percentage — and treat the truth as somewhere between. The state incentives page tracks current programs, and the solar ROI calculator and solar system calculator model adjacent scenarios. A project that only pencils with a credit you cannot document does not pencil.
From Payback Number to Purchase Order
If your payback lands under 10 years, the project is usually worth engineering properly: a designed complete solar kit beats a parts pile on mismatch, permitting, and warranty support. Browse residential panels, grid-tied systems, and the full panel catalog; the kit buyer's guide covers scope. And if the underlying question is whether your house's consumption justifies the size, can solar panels power a whole house is the honest walkthrough. Hit the calculator's quote button and your cost, production, and payback figures go straight to our design desk for a real number.
What This Calculator Deliberately Leaves Out
Honest math needs honest omissions. Five real-world costs sit outside the model, and none of them changes a good project into a bad one — but they belong in a serious budget. First, inverter replacement: string inverters typically need one replacement around years 12–15 (budget $1,500–$3,000 in today's dollars); microinverters carry 25-year warranties but still fail occasionally. Second, operations and maintenance: cleaning, monitoring subscriptions, and the occasional critter guard repair — call it $150–$300/yr if you outsource everything, near zero if you hose the array yourself. Third, roof work: removing and reinstalling the array for a re-roof runs $2,000–$5,000, which is why we tell anyone with a roof older than 10–12 years to re-roof first. Fourth, insurance: most carriers add solar to a homeowner's policy for a small premium. Fifth, permitting and interconnection fees should already live inside your installed cost — if a quote lists them separately, they are not actually included. Net these against the 25-year gain column and a strong project still stands with both feet on the ground; that is the point of running the numbers before signing.
Frequently Asked Questions
What is a good payback period for solar panels?
Under 10 years is generally considered strong in 2026; under 8 years is excellent. Between 10 and 15 years the project still wins on 25-year economics but depends on staying in the home. Over 15 years, revisit the price, the rate assumptions, or the roof before proceeding.
How do I calculate solar payback myself?
Divide net system cost (installed price minus incentives you actually qualify for) by annual savings (annual kWh production times your all-in utility rate). A $14,000 net cost against $1,600/yr savings is an 8.75-year payback.
Does solar still make sense without the federal tax credit?
In high-rate markets, yes — at $0.22/kWh a well-priced system pays back in 9–11 years with zero incentive. In low-rate markets it becomes a 15+ year proposition, where equipment price discipline and any state or utility incentives decide the outcome.
How much do solar panels degrade per year?
Modern monocrystalline panels degrade about 0.4–0.6% annually, with most manufacturers warranting 85–87.5% of nameplate output at year 25. Degradation barely moves the payback number but shaves a few percent off lifetime savings.
Should I use my bill's generation rate or total rate for savings?
Total rate: divide the entire bill (supply, delivery, riders, fees) by kWh used. Solar offsets almost all of it under net metering. Using the generation-only line understates savings by 30–50% in many territories.
What happens to the math if I finance the system?
Loan interest adds to the effective cost — at typical solar loan rates, payback stretches roughly 2–4 years versus cash. The calculator's cash-basis result is the reference; subtract loan interest from the 25-year net gain for the financed picture.