2026 H1 Solar Industry Recap: Record Installations, Tariff Uncertainty, and Storage Dominance
Published June 30, 2026 — PES Supply News
The first half of 2026 will be remembered as a turning point for the U.S. solar industry. The nation crossed six million cumulative solar installations, solar-plus-storage captured 91% of all new grid capacity additions, and residential battery storage set quarterly records — all while the industry absorbed the sharpest federal tax-policy shift in a decade. For installers and contractors, the headline numbers tell only part of the story. Beneath the records, a post-tax-credit world is reshaping procurement, project economics, and the storage attachment decision on every quote that leaves the office.
I've spent twenty years watching this industry ride policy roller coasters — the 2016 ITC cliff that wasn't, the COVID supply crunch, the 2022 AD/CVD panic — and I'll tell you the contractors who survive every cycle share one habit: they read the quarterly data themselves instead of waiting for a sales rep's summary. This recap synthesizes the most consequential developments of 2026 H1 across installation data, IRA and tariff policy, battery storage, domestic content compliance, and interconnection reform, with the procurement takeaways we give our own contractor customers at PES Supply, where we track these shifts across our 50,000+ SKUs from 169 authorized brands.
The SEIA/Wood Mackenzie U.S. Solar Market Insight 2026 Q2 Report, released in June 2026, confirms that the United States installed 7.8 GWdc of new solar capacity in Q1 2026 — a 27% decline year-over-year and a 42% drop from Q4 2025 (Renewability.net). Despite the quarterly pullback, the milestone headline stands: the country surpassed six million cumulative solar installations during H1 2026, an all-time high.
| Segment | Q1 2026 Capacity | Year-over-Year Change |
|---|---|---|
| Total U.S. solar | 7.8 GWdc | -27% |
| Utility-scale | 5.9 GWdc | -34% |
| Residential | 1,179 MWdc | +6% |
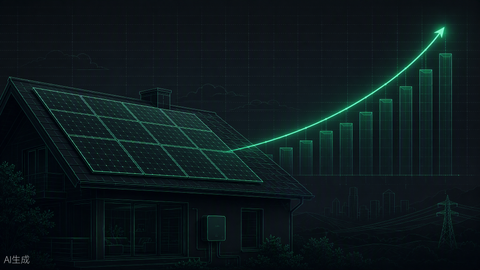
Read that table twice, because it inverts the usual story. Utility-scale — the segment that carried 2024 and 2025 — fell off a cliff as developers pulled forward every megawatt they could into 2025 to beat the tax-credit deadlines. Residential, the segment everyone wrote obituaries for after the 2023–2024 rate shock, actually grew 6% year-over-year. The residential reset is real: installers who survived the contraction are running leaner crews, higher close rates, and storage-first sales motions. Our own order flow matches it — battery-attached residential BOMs are the majority of what we ship now, and two years ago they were a rounding error.
The defining policy event of H1 2026 was the residential clean energy credit (Section 25D) expiring on its legislated schedule at the end of 2025, with the commercial credits (Sections 45Y/48E) entering their phase-down and domestic-content-conditioned era. The result is the "post-tax-credit world" the report names: residential systems now pencil on retail rate arbitrage, resilience value, and state incentives rather than the federal 30% that anchored sales pitches for two decades.
What that means on the ground, from the quotes crossing our desk:
- Cash and loan economics tightened. Payback periods in moderate-rate states stretched 2–4 years; high-rate states (California, the Northeast, Hawaii) barely noticed because retail rates did the work the ITC used to do.
- State incentives matter more than they have in a decade. Program details move monthly — keep our solar incentives by state reference bookmarked and re-verify before every proposal.
- Financing mix shifted. TPO providers restructured around the commercial credits they can still claim; lease and PPA share climbed through H1 as third-party owners monetize 48E where homeowners no longer can.
- Procurement moved earlier. With pricing no longer subsidized at the point of sale, contractors are locking equipment pricing at contract signing rather than at permit — the solar ROI calculator conversation now happens before the site survey, not after.
H1 2026 delivered the most volatile tariff environment since the 2018 Section 201 case. Successive rounds of duties and trade actions on cells, modules, and polysilicon from Southeast Asia and China re-priced module imports twice in six months, and the uncertainty itself became a line item: EPCs added explicit tariff-escalation clauses to contracts signed after March, and we watched spot module pricing for Tier 1 imports move several cents per watt in single weeks.
| Procurement Factor | 2024–2025 Norm | H1 2026 Reality | Contractor Response |
|---|---|---|---|
| Module price stability | Quarterly drift of 1–2 ¢/W | Weekly swings of 3–5 ¢/W on imports | Lock pricing at contract, not permit |
| Lead times | 4–8 weeks predictable | 2–14 weeks depending on tariff window | Hold attic stock on fast-moving SKUs |
| Domestic modules | Price premium, niche demand | Premium narrowed; allocation waitlists | Reserve domestic supply early for BABA projects |
| Contract structure | Fixed-price EPC standard | Tariff-escalation clauses common | Review escalation language with counsel |
The practical advice we give every contractor who calls: stop quoting equipment prices older than 30 days, and build a second-source relationship for every critical SKU. The contractors who got burned in H1 weren't underpriced — they were single-sourced.
Storage is no longer an add-on; it's the business model. Solar-plus-storage captured 91% of all new grid capacity additions in H1, and the national residential attachment rate hit 45% in Q1 — nearly double the 2024 level:
| Period | National Attachment Rate | Source |
|---|---|---|
| 2024 | ~25% | SEIA/Wood Mackenzie |
| Q1 2025 | 38% | Wood Mackenzie |
| Q1 2026 | 45% | Wood Mackenzie / ACP |
Three forces converged. First, the post-credit economics push customers toward self-consumption value, which requires storage in export-limited and NEM 3.0-style territories. Second, grid instability keeps selling resilience — every hurricane and heat-dome season converts another cohort of homeowners. Third, battery hardware itself kept getting cheaper per kWh even as modules got tariffed, so the storage line item grew as a share of system cost while the total stayed sellable. If your crews aren't fluent in battery sizing yet, our home battery bank sizing guide and battery backup runtime calculator are the two pages our contractor customers use most, and the solar inverter buyers guide covers the hybrid-inverter half of the decision. Browse the battery storage inventory and hybrid inverters when you're ready to build the BOM.
Domestic content didn't disappear with the residential credit — it migrated into the commercial stack, where the 10-percentage-point adder and BABA requirements on federally funded work now drive procurement decisions that used to be price-only. The H1 reality: domestic module, racking, and inverter supply exists at scale for the first time, but allocation is tight and lead times run long. Projects with September commissioning dates that didn't reserve domestic BOMs in Q1 spent Q2 scrambling.
Our field guidance: decide the domestic-content strategy at bid time, not at procurement time, and document the bill of materials against the current IRS safe-harbor tables — the manufactured-products percentage math is where compliance projects most often fail an audit. The NEC code compliance guide covers the electrical side; the domestic-content side needs your accountant and your distributor talking early.
The quiet story of H1 — and maybe the most consequential for 2027 project pipelines — was interconnection reform actually moving:
| Date | Action | Significance |
|---|---|---|
| June 9, 2026 | FERC approved PJM Expedited Interconnection Track (EIT) | Fast-lane for 250+ MW shovel-ready projects; effective July 31, 2026 |
| June 18, 2026 | FERC issued show-cause orders to all 6 RTOs/ISOs | Directing large-load tariff reforms; 50 MW threshold |
| April 2026 | FERC accepted PJM's revised Order 2023 compliance filing in part | Ongoing cluster-study process implementation |
The EIT fast-lane matters because queue position, not equipment, is the binding constraint on utility-scale supply through 2028. If PJM's model holds, expect the other RTOs to face pressure to copy it — the show-cause orders signal FERC's patience with queue backlogs is over. For C&I developers, watch the 50 MW large-load tariff reforms: data-center load is reshaping who gets transmission service and at what price, and that flows straight into where solar-plus-storage projects pencil.
With the federal anchor gone, state policy did the differentiating in H1 2026. The states our contractor customers talk about most:
- California: NEM 3.0 economics kept pushing the market storage-first; attachment rates in the state run far above the national 45%, and the avoided-cost calculator updates continued to reward evening export windows that only batteries can serve.
- Texas: No state incentive, no problem — retail rate volatility and grid-reliability anxiety kept ERCOT residential demand growing, with storage sold on resilience as much as arbitrage.
- Florida: Hurricane-season resilience marketing plus relatively intact net metering kept volumes steady; the insurance-driven re-roof cycle continued to bundle solar attachment work.
- Northeast (NY, NJ, MA, CT): High retail rates did the work the ITC used to do. Payback math survived the credit expiry better here than anywhere else in the country.
- Illinois and the Midwest community-solar states: Adjustable-block and community programs kept commercial pipelines full even as utility-scale slowed.
The through-line: markets now price on retail rates, resilience, and program design — three things that change state by state and quarter by quarter. Check current program rules in our solar incentives by state tracker before you build a Q3 proposal on Q1 assumptions.
The less-noticed H1 story was the domestic supply base maturing on schedule. U.S. module nameplate capacity continued climbing through H1 2026, cell manufacturing finally arrived at meaningful scale after years of module-only assembly, and inverter and racking domestication followed the credits. For procurement teams the shift is practical: "domestic" is no longer a single-source gamble — it's a competitive category with real allocation queues. That maturation is precisely why BABA and domestic-content compliance got stricter in enforcement this half: the supply exists, so the waivers got harder to win.
Our sourcing desk now runs parallel BOMs on most commercial quotes — import and domestic — because the 10-point adder and tariff exposure routinely flip the cheaper option between the two. Contractors bidding public work without a domestic BOM in hand are bidding with a handicap.
Three threads we're tracking into the second half. First, whether residential's 6% growth holds through the summer selling season without the credit — early channel checks say yes, driven by storage-attached systems and TPO structures monetizing commercial credits. Second, whether the tariff docket stabilizes enough for import pricing to find a floor; EPCs are writing Q4 procurement contracts now and the escalation language in those contracts will set 2027 margins. Third, the RTO response to FERC's show-cause orders — if the large-load tariff reforms land as drafted, expect a visible re-mapping of where C&I and community solar pipelines concentrate in 2027.
Sell resilience and rate arbitrage, not subsidies
The 30% federal anchor is gone from residential. The pitches that close now lead with backup hours, self-consumption math, and utility-rate inflation hedges.
Make storage the default, not the upsell
At 45% attachment and climbing, a PV-only proposal increasingly reads as an incomplete proposal. Spec the hybrid inverter even when the battery waits — retrofit labor is where margin dies.
Lock equipment pricing early and second-source everything
Tariff volatility punishes 60-day-old quotes. We hold pricing windows for contractor accounts precisely because the market stopped holding still.
Reserve domestic-content BOMs at bid time
BABA and adder-driven projects can't wait for procurement-phase decisions anymore. Allocation is the new normal on domestic modules and racking.
Watch interconnection reform for your 2027–2028 pipeline
PJM's EIT and the large-load tariffs will re-map where C&I and community solar projects are buildable. The queue is the market now.
Did U.S. solar installations grow or shrink in the first half of 2026?
Both, depending on the segment. Total Q1 2026 installations of 7.8 GWdc fell 27% year-over-year, driven by a 34% collapse in utility-scale after 2025's pull-forward. But residential grew 6% year-over-year, and the country passed six million cumulative installations — an all-time record.
Is the federal solar tax credit still available in 2026?
The residential Section 25D credit expired at the end of 2025. Commercial credits under Sections 45Y/48E continue in phase-down form with domestic-content conditions, which is why third-party-ownership structures gained share through H1 2026.
What is the storage attachment rate in 2026?
The national residential storage attachment rate reached 45% in Q1 2026, up from roughly 38% in Q1 2025 and about 25% in 2024, according to Wood Mackenzie and ACP data. Solar-plus-storage accounted for 91% of all new grid capacity additions in H1.
How are the 2026 tariffs affecting module prices?
Import module pricing swung 3–5 cents per watt within single weeks during H1 as successive trade actions re-priced cells and modules from Southeast Asia and China. Domestic module premiums narrowed but allocation tightened. Contractors are responding with tariff-escalation clauses and earlier price locks.
What is FERC's Expedited Interconnection Track?
Approved June 9, 2026 and effective July 31, 2026, PJM's EIT creates a fast lane for shovel-ready projects of 250 MW or more, bypassing portions of the backlogged cluster-study queue. It's the first concrete acceleration since Order 2023 and a template other RTOs may be pushed to follow.
H1 2026 ends the era of subsidy-anchored residential solar and opens the storage-dominant, procurement-driven era. The industry is smaller than the 2025 peak by gigawatts and bigger than ever by cumulative installs, grid share, and strategic importance. The contractors who treat the second half of 2026 as a procurement discipline — early price locks, second sources, storage-first design, domestic-content planning — will look back on this as the half-year their operations grew up. Equipment to consider: browse our solar panels, battery storage, and hybrid inverter inventories — all available with 7–10 business day delivery from PES Supply's 50,000+ SKUs across 169 authorized brands.
PES Supply (https://www.portlandiaelectric.supply) is a B2B electrical and solar distributor. Market figures cited from SEIA/Wood Mackenzie U.S. Solar Market Insight Q2 2026, ACP, and FERC filings as published; verify program details against primary sources before relying on them in project documents.