Last Updated: April 2026 • Based on California Title 24 Energy Standards, NEC 2026, and California Interconnection Rule 21

School District in California Deploys 3.1 MW Solar System Across 12 Campuses
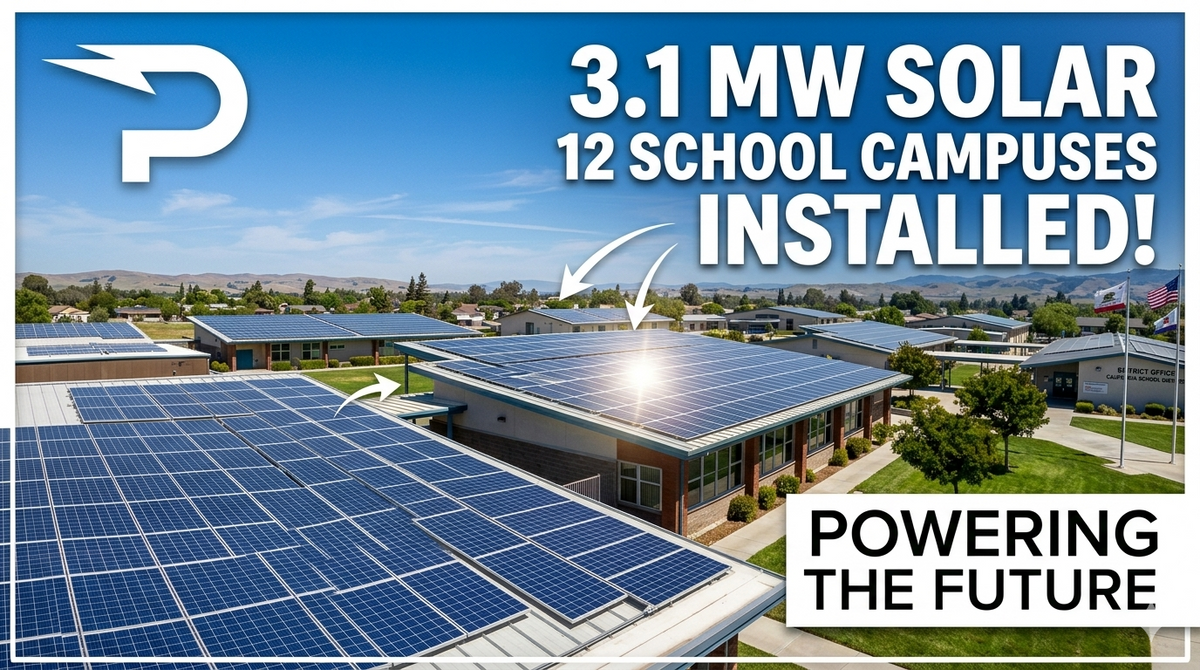
A California school district has completed the installation of 3.1 MW of solar capacity across 12 campuses, delivering one of the most comprehensive K–12 solar deployment programs in the state. The project transforms the district's energy profile — dramatically reducing utility costs, lowering carbon emissions, and creating real-world STEM learning opportunities for thousands of students across every participating school site.
This case study examines how the project was engineered, financed, and executed — from site assessment and system design through interconnection, commissioning, and long-term O&M planning — and what other districts, EPCs, and developers can lift from this model multi-site deployment. I've walked job walks on school solar since the Prop 39 era, and the districts that succeed all do the same three things: aggregate the campuses into one procurement, design to the utility's Rule 21 playbook from day one, and put battery storage where the demand charges live. This project did all three.
The program aggregates 12 campuses — two high schools, three middle schools, six elementary schools, and the district administration/operations center — into one engineered, procured, and interconnected portfolio. Total installed capacity of 3.1 MW DC breaks down to an average of roughly 258 kW per campus, with system sizes tuned to each site's load profile, available mounting area, and electrical service capacity.
Key takeaways before the detail:
- Multi-site scale: Aggregating 12 campuses into a single procurement program unlocked bulk pricing, standardized design, and unified interconnection negotiation with the utility.
- Carport-heavy design: Solar carport structures delivered dual value — covered parking for staff and students alongside power generation — without consuming additional land or compromising roof warranties.
- Financing model: A Power Purchase Agreement (PPA) or lease structure eliminated upfront capital expenditure, allowing the district to redirect bond funds to instructional priorities.
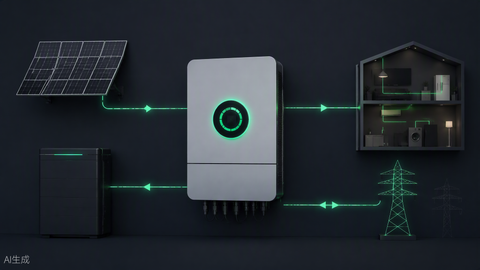
- California Rule 21 compliance: All 12 systems were engineered and submitted under the state's Rule 21 interconnection tariff, with smart-inverter functions enabled from day one.
| Campus Type | Number of Sites | Typical System Size | Primary Mount Type | Storage Included? |
|---|---|---|---|---|
| High School | 2 | 400–500 kW | Solar carport + rooftop | Yes — BESS at both sites |
| Middle School | 3 | 250–320 kW | Solar carport | Yes — 1 of 3 sites |
| Elementary School | 6 | 150–220 kW | Rooftop + ground mount | No |
| District Admin / Operations | 1 | 180 kW | Rooftop | Yes — critical backup |
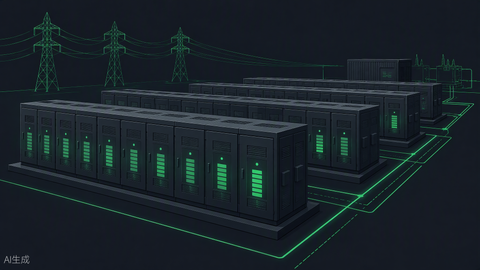
Note where the batteries went: the two largest, most demand-charge-exposed sites and the site with a resilience mission. Storage didn't get sprinkled everywhere — it got aimed. That's the single most copied design decision from programs like this, because demand-charge management and critical-load backup are where batteries pay in K–12, not energy shifting alone. For the storage sizing logic behind decisions like this, see our battery bank sizing guide and commercial battery storage inventory.
Standardization did the heavy lifting. The EPC developed three repeatable design blocks — a carport block, a rooftop block, and a ground-mount block — each with pre-engineered structural calculations, standardized string designs, and identical BOMs scaled by module count. Twelve sites went through plan check with essentially three drawing sets, which cut both engineering cost and DSA (Division of the State Architect) review cycles.
Electrical design followed the same template logic: standardized combiner locations, identical inverter SKUs per block, and uniform conductor schedules so the wire order was one line item per size, times twelve. On multi-site programs, conductor and conduit standardization is where the quiet money hides — our NEC wire sizing guide, ampacity charts, and conduit fill chart are the references your design team will wear out.
| Mount Type | Campuses Using | Key Advantage | Key Consideration |
|---|---|---|---|
| Solar Carport | 5 campuses | Dual-use: shaded parking + power generation; no roof penetrations | Higher structural cost; requires parking lot access during construction |
| Rooftop | 5 campuses | No additional land used; lowest installation cost per kW | Roof age and structural capacity must be verified; DSA review required |
| Ground Mount | 2 campuses | Optimal tilt and azimuth; avoids roof and carport structural constraints | Consumes campus land; requires fencing and security considerations |
The carport-first bias is deliberate and worth copying. California parking lots are heat islands parents complain about every August; covering them with PV converts a liability into shaded parking, visible sustainability, and generation — with no roof-warranty negotiations and no penetrations over classrooms. The premium over rooftop runs real (steel, caissons, and DSA structural review aren't cheap), but on campuses with aging roofs scheduled for replacement inside 10 years, carports avoid the remove-and-reinstall cost that quietly kills rooftop economics. PES Supply stocks racking and mounting systems for all three configurations — see the solar panel racking systems guide for selection detail.
| Financing Model | Upfront Cost | Long-Term Savings | District Owns System? | Best For |
|---|---|---|---|---|
| Power Purchase Agreement (PPA) | $0 | Moderate — savings vs. utility rate over contract term | No — developer owns | Districts with no capital budget; fastest to execute |
| Solar Lease | $0–Low | Moderate — fixed monthly payment below utility cost | No — lessor owns | Similar to PPA; slightly more flexible termination terms |
| Direct Purchase / Bond Funding | Full capital cost | Highest — 100% of savings accrue to district | Yes — full ownership | Districts with bond authorization; maximizes long-term ROI |
| Grant-Funded (Prop 39 / IRA-era programs) | Partially or fully offset | Highest net — grant reduces payback period significantly | Yes — district owns | Best economics; requires grant eligibility and application effort |
This district's structure keeps capital free for classrooms while a third-party owner monetizes the commercial tax credits that public districts can't claim directly — under the post-2025 credit landscape, direct-pay elective treatment for tax-exempt entities changed that calculus, and districts should re-run the own-vs-PPA comparison with current counsel before assuming the old answer. Either way, the non-negotiable term to negotiate is the escalator: a PPA rate escalating 2.9% annually against utility rates escalating 3.5% looks fine until year 14, and boards should model both directions.
6. California Rule 21 Interconnection Process

All 12 systems interconnected under California's Rule 21 tariff with UL 1741 SA/IEEE 1547 smart-inverter functions enabled. The program-level lessons:
| Interconnection Step | Typical Timeline (per site) | Multi-Site Leverage |
|---|---|---|
| Pre-application / capacity screen | 2–4 weeks | One utility account team for all 12 sites |
| Fast-track or detailed study | 4–12 weeks | Standardized designs simplify review |
| Interconnection agreement | 4–8 weeks | Template negotiated once, executed twelve times |
| Permission to operate (PTO) | 2–6 weeks post-inspection | Batched inspection scheduling with AHJ |
Two hard-won notes. First, submit all 12 applications within the same quarter — circuit capacity screens age, and a site that screened clean in March can land behind someone else's project by September. Second, enable the Rule 21 grid functions at commissioning even where the utility doesn't require them yet; re-flashing 60 inverters later because a tariff changed is labor nobody budgeted.
A third note for districts replicating this: the utility relationship is a program asset, not a per-site transaction. The district's account manager sat in on quarterly program reviews, saw the portfolio-level data, and had context when a circuit question arose — which turned two potential "detailed study" determinations into fast-track approvals. That kind of relationship doesn't show up in the pro forma, and it's worth more than a half-cent on the equipment price.
Finally, budget the interconnection upgrades honestly. Two of the twelve sites required transformer or service-section work at utility cost-sharing rates. The program carried a contingency line for exactly this, and the sites that needed it still penciled because the contingency was priced before the board vote, not discovered after. Districts that present interconnection as free learn otherwise in front of their boards, and that is a difficult meeting.
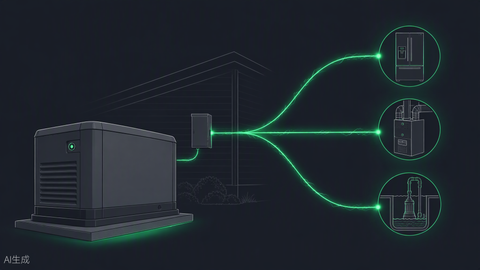
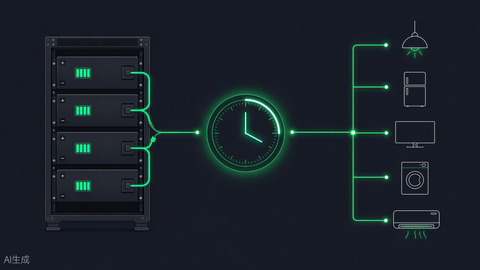
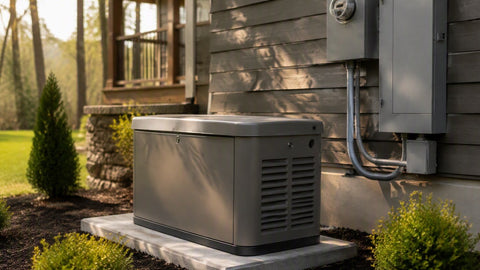
The four BESS-equipped sites share one control philosophy: peak-shave the 15-minute demand window first, serve resilience second, arbitrage energy third. School load profiles — sharp HVAC-driven afternoon peaks that collapse at 3:30 p.m. — are nearly ideal for demand-charge management, and the admin center's battery doubles as backup for the district's IT and communications rack. Critical-load panels at the resilience sites were scoped tightly: refrigeration, IT, emergency lighting, and one HVAC zone, not the whole building. Oversizing the critical-load panel is the most expensive mistake in school storage design, and it happens constantly.
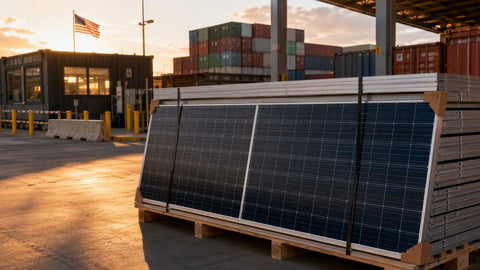
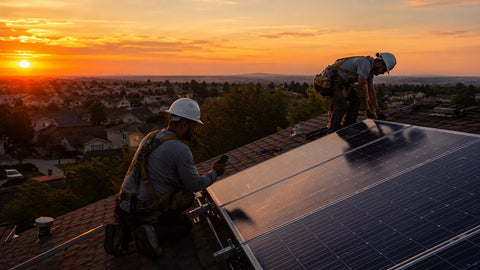
Execution ran as a rolling wave: two campuses under construction at any time, staggered four weeks apart, so the same specialized crews — caisson and steel, module set, electrical, commissioning — moved site to site without demobilization. Summer break absorbed the high-disruption work (lot closures for carports, crane picks over buildings), with punch-list and PTO chasing into the fall. Material flow used kitting: each site's BOM shipped as a complete kit, which eliminated the mid-project "we're short 40 clamps" stoppage that plagues multi-site programs run as twelve separate purchase orders. We kit multi-site orders the same way on the distribution side — one project quote, twelve labeled pallets.
Student safety logistics deserve a mention because every district asks. Active construction zones were fenced, badged, and separated from student traffic with dedicated equipment routes timed around drop-off and pickup windows. Crane picks over occupied-adjacent areas happened on weekends and break days only. The general contractor ran a daily coordination call with each campus's office during active weeks — fifteen minutes that prevented every "a delivery truck is blocking the bus lane" incident before it happened.
| Performance Metric | Projected Annual Value | 25-Year Cumulative |
|---|---|---|
| Total Energy Generated | ~4,650 MWh/year | ~108,000 MWh |
| Utility Cost Savings | $500,000–$700,000/year | $12M–$17M (undiscounted) |
| CO₂ Emissions Avoided | ~3,300 metric tons/year | ~82,500 metric tons |
| Equivalent Cars Removed | ~715 vehicles/year | ~17,900 vehicle-years |
| Homes Powered Equivalent | ~430 California homes | Continuous for 25 years |
The savings range is wide for an honest reason: California rate design changes mid-decade shifted value between energy and demand components, and the battery sites capture demand savings that don't show in simple kWh math. Districts modeling their own programs should run both a kWh-only case and a demand-managed case — the delta between them is frequently the storage business case by itself.
The program's operations and maintenance structure deserves its own section because it's where school solar programs quietly fail in years 5–15. The district's O&M agreement covers quarterly remote monitoring review, annual preventive maintenance (torque checks, thermal imaging of combiners and inverters, vegetation and soiling assessment), panel washing on a soiling-triggered schedule rather than a calendar one, and a guaranteed response time for outage events. Performance reporting rolls up to a district energy dashboard the facilities director reviews monthly.
Three O&M provisions worth copying into any K–12 contract: a production guarantee with liquidated damages (the PPA provider owns performance risk, not the district), an inverter replacement reserve funded from year one (inverters are the component that dies inside the contract term — plan for it), and an explicit roof-coordination clause assigning remove-and-reinstall responsibility and cost if a rooftop site's membrane needs work. The districts that skip that clause discover it during the first re-roof, and it's an expensive discovery.
The procurement ran as a single RFP covering all 12 sites with optional pricing per site — a structure that let the district award the whole portfolio while preserving the flexibility to drop a problem site without re-bidding. Evaluation weighted lifecycle value over first cost: production guarantees, O&M terms, equipment tier, and the bidder's interconnection track record with the incumbent utility all outscored raw $/W in the final matrix.
Schedule discipline came from the contract, not goodwill: liquidated damages tied to the summer construction window, a guaranteed substantial-completion date before the fall semester, and milestone payments against inspected progress rather than calendar dates. Districts writing their own RFPs should steal one more clause from this one: the requirement that the winning bidder stock spare inverters and a spare module pallet locally for the contract term. Fleet-standardized equipment plus local spares is what turns a failed inverter from a three-week outage into a two-day swap.
12. STEM Education and Community Impact

Every site's monitoring feed lands on a public dashboard, and the district built curriculum modules around live array data — physics classes calculating expected output from irradiance, math classes regression-testing performance against temperature, elementary students tracking their school's daily generation against the neighboring middle school. The carports double as the visible proof: parents who never read a sustainability report notice shaded parking and a kiosk screen. Programs that skip the dashboard integration leave the cheapest community goodwill in the industry unclaimed.
The community payoff extended past the classroom. The district hosts an annual "solar Saturday" at a carport campus where facilities staff walk parents through the systems, and the bond-oversight committee now uses the energy dashboard as its standing exhibit on how capital dollars perform. Board meeting packets include a one-page generation summary each month — twelve lines, one per campus — that turned energy from an invisible utility bill into a visible, comprehensible asset. Districts shopping for community support on the next bond measure should take notes: visible generation data is the best bond-campaign material a facilities department will ever own.
The screening matrix that cut 19 candidates to 12 didn't discard the other seven — it queued them. Phase two planning, already underway, targets the deferred elementary campuses, EV charging for the district's growing electric bus fleet at the operations center (where the existing battery and solar create a ready-made microgrid backbone), and expanded storage at the middle schools as demand charges continue to climb. The phase-two business case benefits from everything phase one learned: the design blocks are drawn, the utility account team knows the district's portfolio, the DSA templates exist, and the O&M contractor has two years of site history. The marginal cost of the second wave of campuses will run meaningfully below the first — which is, in the end, the strongest argument for thinking in portfolios instead of projects.
Aggregate or perish
Twelve campuses as one program cut per-watt soft costs dramatically versus twelve standalone projects. One utility account team, three drawing sets, one BOM template, one financing negotiation.
Carports first, rooftops where young, ground where land allows
The mount-type decision is a 25-year maintenance decision, not just a capex line. Aging roofs push you to carports; new roofs are free real estate.
Aim storage at demand charges and resilience, not everywhere
Four batteries placed deliberately outperformed a dozen placed democratically. Scope critical-load panels tightly.
Kit the material flow
Site-labeled complete kits keep a rolling-wave schedule rolling. Partial shipments turn two active sites into two stalled sites.
Turn the dashboards on before the ribbon cutting
The STEM and community value compounds from day one — but only if the data is public, legible, and pitched to the curriculum team early.
School construction in California runs through the Division of the State Architect, and solar is no exception — every attachment to a school building and every carport structure over a public parking lot carries DSA structural review. The program's standardized blocks paid their biggest dividend here: three pre-checked structural packages (carport, rooftop, ground mount) went through review once at the template level, then site-specific adaptations moved through as addenda instead of twelve from-scratch submittals.
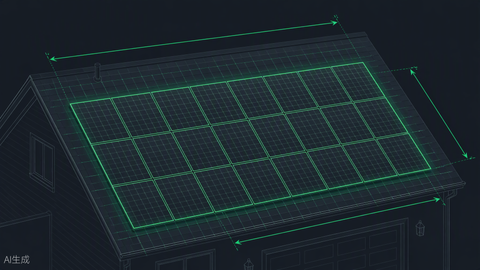
The carport structures carried the heaviest engineering: caisson foundations drilled to geotechnical depths per site soils reports, steel columns sized for wind and seismic loads with the full DSA calculation package, and — the detail that matters on a school site — crash protection and clearance heights engineered for buses and parent pickup traffic, not just passenger cars. Rooftop sites required existing-condition verification: core samples, as-built drawing pulls from the district's archive (some dating to 1960s construction), and in two cases, structural upgrades to purlins before a single attachment was set. Ground-mount sites needed fencing, security lighting consideration, and coordination with the campuses' emergency egress plans. None of this is glamorous, and all of it is where school solar schedules are actually made or broken — the module delivery is two weeks; the DSA cycle is measured in months. Districts scoping their own programs should also order the geotechnical borings and as-built verification surveys in the first month; the programs that stall are almost always waiting on a soils report nobody ordered, not on panels sitting in a warehouse. The pre-approved structural templates and the inspector-of-record familiarity described below only exist because this district paid for that groundwork early.
Structural engineering had one more quiet win worth naming: the rooftop sites reused a single pre-approved attachment detail across all five campuses, which meant the district's inspector of record learned one detail and inspected it twelve times. Consistency at that level compounds — fewer RFIs, fewer corrections, fewer re-inspection fees, and a relationship with the IOR that made phase two's review cycles measurably faster.
The district's original facilities inventory listed 19 candidate sites. The assessment process cut it to 12 on four screens, in this order:
Load and rate-tariff screen
Twelve months of interval data per meter, mapped against the utility's rate options. Sites whose load profiles couldn't absorb solar at a saving (small evening-shifted loads, already-optimal tariffs) dropped out here — solar on the wrong tariff is an expensive decoration.
Physical capacity screen
Usable roof area adjusted for setbacks, HVAC equipment, and shading; parking-lot geometry for carports; open land with security feasibility for ground mounts. This screen killed one beloved candidate: a historic auditorium whose roof couldn't take attachments without a preservation review nobody had time for.
Electrical infrastructure screen
Service size, panel age and condition, and interconnection feasibility at the circuit level. Two sites needed service upgrades that penciled; one needed a transformer upgrade that didn't, and it moved to a phase-two wish list.
Construction logistics screen
Crane access, laydown area, student-safety separation during the school year, and summer-work feasibility. The campuses that passed all four screens became the 12; the rest wait for phase two with better data behind them.
The discipline of saying no is the least-copied best practice in the whole program. Every district has a board member's favorite campus; the screening matrix gave the facilities team a defensible, documented reason that favorite wasn't in wave one.
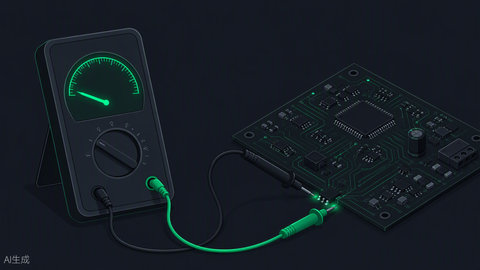
Commissioning ran per campus against a single checklist template: string-level voltage and polarity verification, insulation resistance testing on every source circuit, inverter grid-profile confirmation against the Rule 21 settings file, rapid-shutdown functional testing with the fire marshal's preferred initiation sequence, monitoring point-to-point verification, and the utility witness test where required. The batteries commissioned separately, with demand-shave setpoints tuned against each site's actual interval data rather than nameplate guesses — the first month of operation at the high schools fed a setpoint revision that recovered an estimated 8% more demand savings than the design assumptions.
The lesson EPCs underweight: schedule the utility witness early and bundle campuses. The program batched witness tests two campuses at a time, and even then, witness availability — not construction completion — set the PTO dates on three of the twelve sites. Build the float into the board presentation, because the board remembers the date you gave them, not the reason it moved.
One more commissioning practice worth copying: every campus closed out with a training session for the site custodian and the district facilities tech covering the three things they actually need — where the AC and DC disconnects are, what the monitoring dashboard's normal looks like, and who to call for what. Laminated one-pagers went into the custodial office at each school, with photos of that site's actual equipment rather than generic diagrams. A year later, the O&M provider reported that roughly half of their incoming calls from the district referenced the one-pagers, and several nuisance alarms were resolved by custodians cycling a disconnect correctly instead of waiting for a truck roll. Ten laminated pages saved an estimated dozen service visits — the cheapest O&M investment in the entire program.
How much does a multi-campus school solar program cost?
All-in installed costs for aggregated K–12 portfolios in California typically run below single-site pricing because procurement, engineering, and interconnection are shared. Under a PPA or lease, the district's upfront cost is zero; direct-purchase portfolios of this scale price in the multi-million-dollar range before incentives and grants.
Why did the project favor solar carports?
Carports deliver dual value — shaded parking plus generation — with no roof penetrations and no roof-warranty conflicts. On campuses with aging roofs, avoiding a future remove-and-reinstall cycle often justifies the structural premium on its own.
How long does Rule 21 interconnection take for a school district?
Per site, plan on roughly three to six months from application to permission to operate, depending on circuit capacity and study requirements. Aggregated programs negotiate the template once and execute it across all sites, which compresses the portfolio schedule significantly.
Should every campus get battery storage?
No. In this program, batteries went to the two largest demand-charge-exposed high schools, one middle school, and the admin center with a critical-load mission. Demand-charge management and targeted resilience pay in K–12; blanket storage rarely does.
What can other districts copy directly?
Five things: aggregate campuses into one procurement, standardize to a handful of design blocks, aim storage deliberately, kit materials per site, and publish the monitoring dashboards on day one for STEM and community value.
PES Supply supplies commercial and institutional solar programs end to end: commercial solar panels, commercial inverters, battery energy storage, combiner boxes, and racking for carport, rooftop, and ground-mount — kitting available for multi-site programs. Request a district or EPC program quote →
PES Supply (https://www.portlandiaelectric.supply) is a B2B electrical and solar distributor with 50,000+ SKUs from 169 authorized brands. Project figures are as reported for this deployment; verify program, tariff, and incentive details against current primary sources.