For two decades, electricity demand in the rich world was a flat line — utilities planned around efficiency gains eating whatever growth air conditioners and gadgets produced. That era is over. Global electricity demand jumped about 4.3% in 2024, the fastest sustained growth in years, and the International Energy Agency now projects demand climbing near 4% annually through the late 2020s. Data centers, electric vehicles, heat pumps, industrial reshoring, and air conditioning across the developing world are stacking onto the grid simultaneously — and the supply side, transmission especially, is not keeping pace. This piece lays out the verified demand numbers, what is driving them, and what the growth means for homeowners, contractors, and anyone who buys electrical equipment.

The Headline Numbers
- +4.3% — global electricity demand growth in 2024 (IEA), roughly double the pace of 2022–2023
- ~415 TWh — data center electricity consumption in 2024, heading toward ~945 TWh by 2030 (IEA)
- ~30,000+ TWh — total global electricity consumption, larger than all other energy carriers' growth combined
- 6.7–12% — the range of total U.S. electricity that data centers could consume by 2028 (Lawrence Berkeley National Laboratory)
- ~4%/yr — projected global demand growth through 2027, requiring new generation at unprecedented pace
The IEA's Electricity report series is the reference dataset here. Its 2025 edition documented the acceleration clearly:
| Period | Global Electricity Demand Growth | Context |
|---|---|---|
| 2022 | ~+2.3% | Energy-crisis year; efficiency and price suppression |
| 2023 | ~+2.2% | Mild weather muted advanced-economy demand |
| 2024 | ~+4.3% | Data centers, heat, electrification converge |
| 2025–2027 (forecast) | ~+4%/yr | IEA projection; among the fastest sustained rates in decades |
To feel what 4% global growth means physically: on a base of roughly 30,000 TWh, each year of 4% growth adds about 1,200 TWh of new electricity demand — more than the entire annual consumption of Japan, every single year. That demand has to be met by new generation, new transmission, and new distribution hardware, much of it built by the contractors and installers we supply every day.
The IEA's dedicated Energy and AI analysis put hard numbers on what was previously anecdote:
| Metric | 2024 | 2030 Projection |
|---|---|---|
| Global data center electricity use | ~415 TWh (~1.5% of world demand) | ~945 TWh (~3%) |
| U.S. data center share of national demand | ~4–5% | LBNL range: 6.7–12% by 2028 |
| Single large AI training campus | 100–500 MW class loads | Gigawatt-scale campuses announced |
One comparison makes the scale concrete: a single 500 MW data center campus, running continuously, consumes about 4.4 TWh per year — the annual electricity of roughly 400,000 average U.S. homes. And these loads arrive fast: a housing development takes a decade of gradual hookups; a data center signs one interconnection agreement and wants full power in 24 months. That speed mismatch is why regional grids from Northern Virginia to Phoenix are rewriting their load forecasts, and why we track the downstream effects in our energy policy reform analysis.
Data centers get the headlines, but electrification of transport, heating, and industry is the broader wave. Each technology adds a measurable, stackable household or facility load:
| Electrification Driver | Typical Added Annual Consumption | Math Behind the Figure |
|---|---|---|
| Electric vehicle (home charged) | ~3,500 kWh/yr | 12,000 miles ÷ ~3.4 mi/kWh |
| Heat pump (vs. gas furnace) | ~3,000–5,000 kWh/yr heating | Climate-dependent; displaces fuel with kWh |
| Heat pump water heater | ~1,500–2,500 kWh/yr | Replaces gas or resistance electric |
| Induction cooking (vs. gas) | ~300–500 kWh/yr | Daily cooking loads electrified |
| Air conditioning growth (global) | Fastest-growing single end-use in hot climates | Cooling degree days rising with incomes and temperatures |
Add a typical EV plus heat pump conversion and a home's annual consumption rises 6,500–8,500 kWh — a 50–80% increase on the U.S. household average of roughly 10,500 kWh. Multiply that by millions of homes and you see why utilities' demand forecasts are climbing even before a single data center breaks ground. Our coverage of the heat pump and electrification boom and heat pump water heaters goes deeper on the residential side.
Demand growth is global but unevenly distributed:
| Region | Demand Trend | Primary Drivers |
|---|---|---|
| China | ~+6–7%/yr | Industrial electrification, EVs, data centers, cooling |
| India | ~+5–7%/yr | Rising incomes, air conditioning, new connections |
| United States | ~+2%/yr after a flat decade | Data centers, reshoring, EVs, heat pumps |
| European Union | Recovering after 2022–23 contraction | Industrial recovery, electrification policy |
| Southeast Asia / Middle East | ~+4–6%/yr | Cooling demand, industrialization |
The U.S. number deserves emphasis: after roughly fifteen years of near-zero growth, American electricity demand is climbing again. Utilities that planned their systems around flat load are now filing integrated resource plans with growth assumptions they would have called alarmist five years ago.
Demand growth this fast collides with three physical constraints:
- Generation lead times. New gas plants face multi-year turbine backlogs; nuclear takes a decade; renewables build fast but are intermittent. Solar has become the largest source of new U.S. generating capacity precisely because it deploys fastest — see our solar market outlook for the supply picture.
- Interconnection queues. Lawrence Berkeley National Laboratory counts roughly 2.6 TW of proposed generation and storage waiting for grid studies — years of delay between a finished project and permission to connect.
- Transmission. The U.S. builds a fraction of the transmission mileage it built in the 1970s. Generation without transmission is inventory, not supply.
The practical result: capacity prices are spiking in wholesale markets, utilities are delaying fossil retirements, and grid reliability margins are tightening in the exact regions where demand grows fastest. Distributed energy — rooftop solar, home batteries, and standby generation — is shifting from hobbyist territory to mainstream resilience planning. That is the demand side of why our generator market update reads the way it does.
What This Means for Homeowners and Contractors

Macro demand growth becomes concrete at the service panel. Three implications we see play out on real jobs:
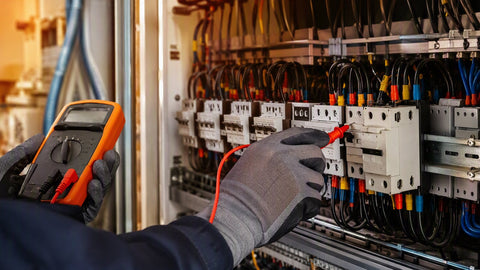
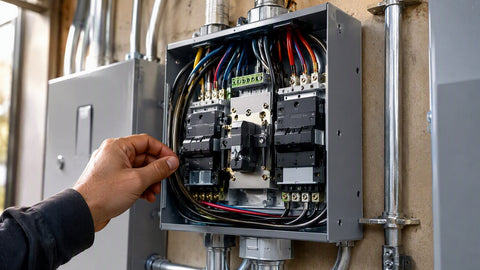
- Panel capacity is the new bottleneck in homes. The electrification stack above — EV charger (40–60A), heat pump, induction range — routinely outgrows a 100A service. The math: 100A × 240V = 24 kVA maximum, while 200A × 240V = 48 kVA. An electrified all-electric home with two EVs wants the 200A panel, full stop.
- Rates will follow capacity costs. When utilities pay more for capacity and build new transmission, retail rates absorb it. Every kilowatt-hour a homeowner generates or shifts off-peak dodges that future rate base — one reason rooftop solar and battery storage economics keep improving even as equipment subsidies wobble.
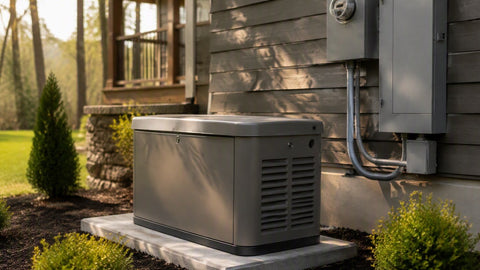
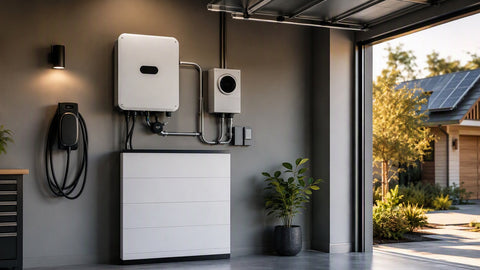
- Resilience spending is demand-driven, not weather-driven alone. Tighter grid margins mean more frequent conservation calls and, in stressed regions, more outages. The whole-home generator sizing guide and the battery sizing guide are the starting points for the two most common resilience projects we quote.
I've watched this shift from the counter: five years ago, most generator and battery buyers were reacting to a storm they had just lived through. Today a growing share walk in because they have read the load-growth news, watched their rates climb, and decided the grid's trajectory is a planning input — not background noise. They are not wrong.
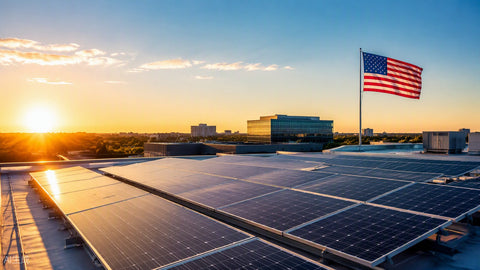
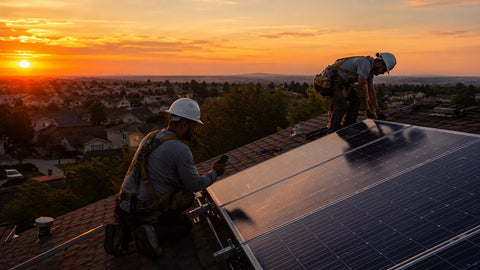
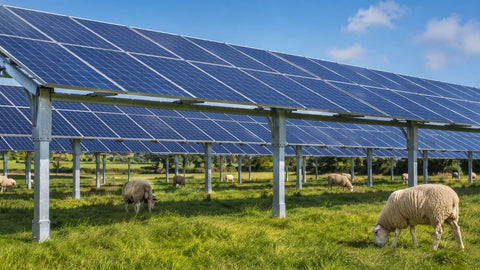
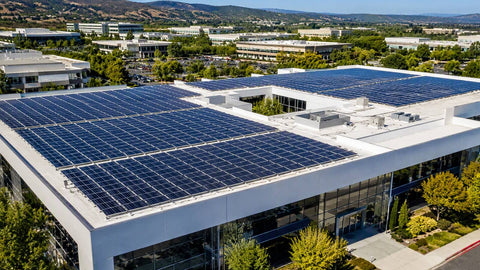
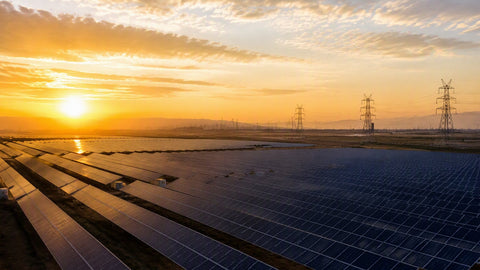
Of all generation technologies, solar PV is uniquely positioned to chase this demand curve, for one structural reason: construction speed. Utility-scale solar farms go from financing to energization in roughly two to three years where interconnection allows — half the timeline of a gas plant and a fraction of nuclear. That is why solar has supplied the majority of new U.S. generating capacity in recent years, and why the IEA's scenarios keep placing PV at the center of supply growth through 2030. Storage is the necessary partner: batteries convert solar's afternoon surplus into evening capacity, and the pairing has become the default utility-scale configuration in high-growth regions.
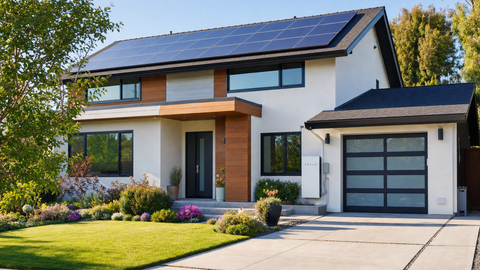
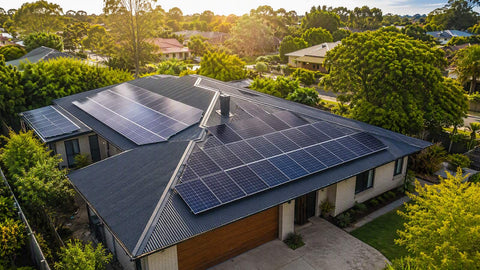
The distributed layer matters too. Every rooftop system and home battery subtracts load from a constrained grid at the exact hours it is most stressed. Policy fights about export rates obscure the physical reality: behind-the-meter generation is demand reduction, and demand reduction is the cheapest grid capacity that exists.
Demand growth is ultimately a physics problem of moving electrons. High-voltage transmission moves power at a fraction of the losses of distribution-level workarounds, yet U.S. transmission construction has run at historically low rates for a decade — a few hundred circuit-miles of 345 kV-and-above lines in recent years against the thousands of miles regional plans call for. Permitting, not engineering or capital, is the binding constraint: multi-state lines cross dozens of jurisdictions, each holding effective veto power.
Until that changes, expect three coping mechanisms to define the decade: grid-enhancing technologies (dynamic line ratings, topology optimization) that squeeze 10–40% more capacity from existing wires at software prices; reconductoring with advanced conductors that doubles a corridor's capacity on the same towers; and continued explosive growth of behind-the-meter and distribution-connected resources that avoid the transmission system altogether. Contractors reading this should recognize the third mechanism — it is the demand engine behind residential and commercial solar-plus-storage for the next decade.
Honest analysis requires stating the failure modes. Demand forecasts can overshoot: if AI efficiency gains compound the way computing efficiency historically has, data center load could land well below the aggressive projections — a possibility even the IEA's scenarios acknowledge with wide uncertainty bands. Forecasts can also undershoot: none of the 2020-vintage models saw the 2024 acceleration coming. The prudent reading treats the numbers as a range with a rising floor, not a point estimate.
What does not change under any scenario is the infrastructure lag. Generation, transmission, and distribution hardware all take years; the equipment procurement decision you make this quarter is a bet on the 2030 grid either way. That asymmetry — fast demand, slow steel — is the one constant in every credible outlook, and it is why we keep telling customers the same thing: capacity you control is capacity you can count on.
Any complete demand picture includes the force working in the opposite direction: efficiency. LED lighting, modern appliance standards, and better building envelopes are why U.S. demand stayed flat through fifteen years of economic growth — each new refrigerator and retrofit quietly erased load even as the economy expanded. That countercurrent is still flowing: every LED conversion and every high-SEER heat pump shaves peak demand, and efficiency remains the cheapest "supply" the grid ever buys.
What changed is the balance. The new loads arriving — data centers, EVs, industrial electrification — are large, fast, and concentrated, while efficiency gains are small, slow, and diffuse. A hyperscale campus adds the load of a city in two years; retrofitting that same city's lighting takes a decade. The era of efficiency quietly canceling growth is over, which is exactly why the growth numbers at the top of this article look the way they do — and why the planning conversation has shifted from managing decline to building capacity.
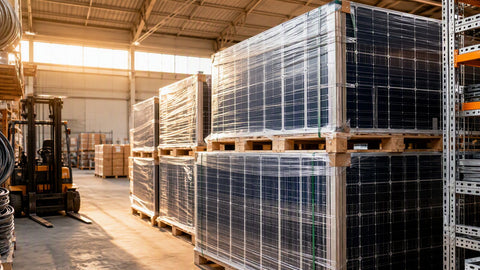
Demand statistics feel abstract until you translate them into lead times and price behavior. Sustained load growth means sustained demand for transformers, switchgear, wire, and generation equipment — and several of those categories, large transformers most notoriously, already carry lead times measured in years. For contractors, the practical translation is simple: quote with realistic lead times, lock pricing where you can, and keep customers informed that the supply chain for grid hardware is tight because the grid itself is being asked to grow again.
For homeowners, the translation is about timing rather than hardware. Rate structures will keep evolving as utilities recover capacity and infrastructure costs — time-of-use rates, demand charges, and evolving export compensation all reward homes that can generate, store, and shift their own energy. The earlier a household builds that capability, the more of the changing rate landscape it can harvest instead of absorb.
There is also a distributional dimension worth naming: demand growth does not hit every ratepayer equally. Regions hosting data center clusters are seeing the sharpest capacity cost increases, while regions with slow load growth enjoy relative stability — at least until the transmission buildout socializes costs more broadly. Households cannot choose their grid, but they can choose their exposure to it, and that choice is rapidly becoming one of the more consequential financial decisions a property owner makes this decade. The tools are mature, the equipment is affordable and widely stocked, and the demand curve above is the reason the window for acting early keeps getting more favorable rather than less.
One more lens completes the picture: energy versus electricity. Total global energy demand — including transport fuels and heating fuels — grows far more slowly than electricity demand, and that divergence is the story of the century. Electricity is winning share from every other energy carrier because it is more efficient at the point of use: an EV converts most of its electricity into motion where a gasoline engine wastes most of its fuel as heat, and a heat pump delivers three units of heat per unit of electricity where a gas furnace can never beat one. As that substitution proceeds, electricity growth can run hot even in a world of modest total energy growth — which is why the electricity-specific numbers in this article, not the headline total-energy figures, are the ones that decide what gets built, what gets backordered, and what your service panel needs to handle.
How fast is global electricity demand growing?
Global electricity demand grew about 4.3% in 2024, according to the IEA, and is projected to keep growing near 4% annually through 2027 — among the fastest sustained rates in decades, roughly double the 2022–2023 pace. On a ~30,000 TWh base, each year of 4% growth adds more demand than Japan consumes in a year.
How much electricity do data centers use?
Data centers consumed roughly 415 TWh globally in 2024 — about 1.5% of world electricity — and the IEA projects approximately 945 TWh by 2030. In the U.S., Lawrence Berkeley National Laboratory estimates data centers could reach 6.7–12% of national electricity use by 2028.
Why is U.S. electricity demand growing after years of flat demand?
Four drivers converged: data center construction, industrial reshoring, electric vehicles, and building electrification (heat pumps, induction). A single EV adds roughly 3,500 kWh/yr of home consumption; a heat-pump conversion adds 3,000–5,000 kWh/yr — stacked together, household demand can rise 50–80%.
Will electricity rates go up because of demand growth?
Upward pressure is likely in growth regions: wholesale capacity prices have spiked in markets like PJM, and new generation and transmission costs flow into retail rates. Self-generation (solar) and load shifting (batteries, off-peak charging) are the main tools households have to blunt that exposure.
What is the biggest bottleneck to meeting electricity demand growth?
Transmission and interconnection, not generation technology. Roughly 2.6 TW of proposed U.S. generation and storage sits in interconnection queues awaiting grid studies, and transmission construction runs at a fraction of historical rates. Projects exist; grid access is the constraint.
Does electricity demand growth mean more power outages?
Not automatically, but tighter supply-demand margins reduce the grid's buffer during heat waves and storms, and stressed regions are seeing more conservation alerts. It is one structural reason behind rising residential interest in standby generators and battery backup systems.
- The Solar Workforce Crisis: Installer Shortage in 2026
- Solar Panels — Full Collection
- Batteries & Energy Storage
- Standby Generators
Plan Your Own Supply
Solar, storage, and standby power from 169 authorized brands — PES Supply ships nationwide from 12+ hubs.
Get a Free Quote