The year 2024 will be remembered in the solar and energy storage industry as a record-setting year wrapped in a policy transition. The United States installed more new solar generating capacity than in any prior year, grid-scale battery deployments roughly doubled their previous annual record, and lithium-ion battery pack prices posted their steepest single-year decline since 2017. At the same time, a federal election in November, four separate trade remedy actions on imported cells and modules, and a Federal Reserve easing cycle that did not begin until September combined to make procurement, pricing, and project finance unusually dynamic. This retrospective records the documented numbers of 2024: the tariff schedule with effective dates and percentages, the quarterly movement of module and cell prices, the storage cost curve in dollars per kilowatt-hour, the capacity additions by segment, and the interest rate decisions that shaped the cost of capital for every project financed during the year.
2024 at a Glance: The Headline Numbers
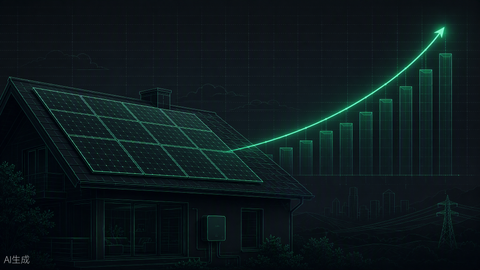
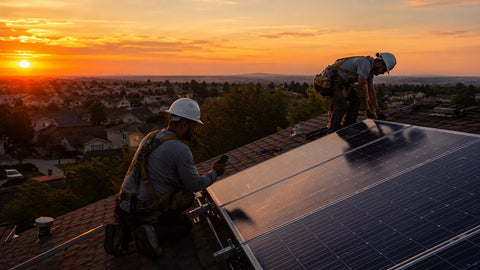
According to the U.S. Solar Market Insight Year in Review report published by the Solar Energy Industries Association (SEIA) and Wood Mackenzie, the United States installed approximately 50 gigawatts direct current (GWdc) of new solar capacity in 2024, a 21 percent increase over the roughly 40.4 GWdc installed in 2023 and nearly double the 20.2 GWdc installed in 2022. Solar accounted for about 66 percent of all new electricity generating capacity added to the U.S. grid during the year, the largest share any single technology has held in the modern era. On the storage side, Wood Mackenzie and the American Clean Power Association recorded roughly 12.3 GW and 37.1 GWh of new energy storage installations in 2024, a year-over-year increase of about 34 percent in power terms and 34 percent in energy terms over the 8.7 GW installed in 2023.
| Metric | 2022 | 2023 | 2024 | 2024 Change vs 2023 |
|---|---|---|---|---|
| New U.S. solar capacity (GWdc) | 20.2 | 40.4 | ~50.0 | +21% |
| Solar share of all new U.S. generating capacity | ~50% | 53% | ~66% | +13 points |
| New U.S. energy storage (GW) | 4.8 | 8.7 | ~12.3 | +34% |
| New U.S. energy storage (GWh) | 12.2 | 26.0 | ~37.1 | +34% |
| Lithium-ion battery pack price ($/kWh, BloombergNEF) | $151 | $139 | $115 | -20% |
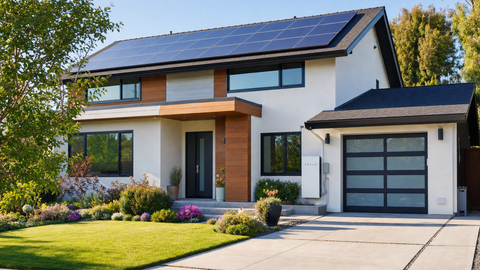
Behind those totals, the composition of the market shifted. Utility-scale solar contributed the majority of new gigawatts, while distributed residential installations declined for the year, pressured by California's Net Billing Tariff transition and by financing costs that remained elevated until the fourth quarter. Commercial and industrial volumes were roughly flat. Storage, by contrast, grew in every segment, with the grid-scale segment setting quarterly installation records in both the second and fourth quarters.
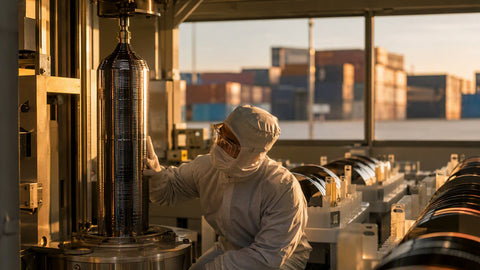
The technology mix changed as decisively as the volumes. TOPCon (tunnel oxide passivated contact) cell architecture completed its displacement of PERC as the dominant production technology during 2024, accounting for the large majority of new Chinese manufacturing output and pushing mainstream module nameplate efficiencies from the 21 percent range toward 22.5 percent and above for commercial product. Module nameplate ratings climbed accordingly, with 600-watt-plus formats standard in utility-scale procurement and 440–460-watt formats common in residential and commercial channels. Buyers comparing current product can review our 460–549W panel selection and our 550–709W panel selection to see how the 2024 efficiency step-up appears in today's catalogs.
Tariff Turbulence: The Complete 2024 Schedule
No single force moved solar hardware pricing and procurement behavior in 2024 more than trade policy. Four overlapping tariff regimes were in play during the year, and three of the four changed in material ways. The table below records each action with its effective date and rate.
| Action | Authority | Announcement Date | Effective Date | Rate / Change |
|---|---|---|---|---|
| Section 201 safeguard tariff, year-7 step-down | Section 201, Trade Act of 1974 | Proclamation 10339 (2022 extension) | February 7, 2024 | 14.75% → 14.25% on crystalline silicon cells and modules |
| Bifacial module exclusion revoked | Section 201 | May 16, 2024 | June 2024 | Bifacial modules re-subjected to the 14.25% safeguard rate |
| Section 301 four-year review increase | Section 301, Trade Act of 1974 | May 14, 2024 | August 1, 2024 | Solar cells (whether or not assembled into modules): 25% → 50% |
| Section 301 increase on polysilicon and wafers | Section 301 | December 11, 2024 | January 1, 2025 | Polysilicon and solar wafers from China: raised to 50% |
| AD/CVD petition on Cambodia, Malaysia, Thailand, Vietnam | Antidumping and Countervailing Duty Acts | April 24, 2024 (petition filed) | Initiation May 15, 2024 | Alleged dumping margins up to 271.28% |
| Preliminary countervailing duties | Department of Commerce | October 1, 2024 | October 2024 | CVD rates from 0.14% to ~292.61% by country and company |
| Preliminary antidumping duties | Department of Commerce | November 29, 2024 | December 2024 | AD rates from 0% to 271.28% (Vietnam-wide rate) |
Three points from this schedule drove real purchasing decisions. First, the Section 201 safeguard tariff stepped down from 14.75 percent to 14.25 percent on February 7, 2024, continuing the scheduled phase-down of the measure first imposed in 2018 at 30 percent. The safeguard is scheduled to expire entirely on February 6, 2026, after a final year at 14.0 percent. Second, the May 16, 2024 presidential proclamation ended the bifacial module exclusion that had allowed two-sided panels to enter duty-free since 2022; from June 2024 forward, imported bifacial modules paid the same 14.25 percent safeguard rate as monofacial product. Third, the Section 301 review doubled the tariff on Chinese solar cells from 25 percent to 50 percent effective August 1, 2024, and the December 11, 2024 announcement extended the 50 percent rate to polysilicon and wafers effective January 1, 2025.
The antidumping and countervailing duty case against the four Southeast Asian producing countries was the year's largest source of procurement uncertainty. The American Alliance for Solar Manufacturing Trade Committee filed petitions on April 24, 2024; the Department of Commerce initiated investigations on May 15, 2024; preliminary countervailing duty determinations were announced October 1, 2024; and preliminary antidumping determinations followed on November 29, 2024, with calculated rates ranging from zero for certain Malaysian and Vietnamese respondents up to 271.28 percent at the Vietnam-wide rate. Because the four countries historically supplied the majority of U.S. module imports, buyers accelerated purchases ahead of each preliminary determination, and domestic module assembly capacity became strategically more valuable.
Installers and distributors who stock product adapted by diversifying bills of material. Our catalog of solar panels and USA-made solar panels both saw increased inquiry volume in the second half of the year, and the N-type solar panel segment grew as buyers moved toward TOPCon product that dominated 2024 production lines.
Module and Cell Prices: The Quarterly Record
Global module prices fell to historic lows in 2024 as Chinese manufacturing overcapacity persisted. Industry price indexes tracked by InfoLink Consulting and PVInsights showed mainstream TOPCon module spot prices in export markets declining from roughly $0.115 per watt in the first quarter to approximately $0.088 per watt by the fourth quarter, a decline of about 23 percent within the calendar year. Chinese domestic module prices fell even lower, with some fourth-quarter tenders clearing below $0.09 per watt. Polysilicon prices spent most of the year below cash production cost for many producers, falling from roughly $8–9 per kilogram early in the year to the $5–6 range by December.
| Quarter | Global TOPCon Module Spot ($/W, approx.) | China Domestic Module ($/W, approx.) | U.S. Module Price ($/W, approx.) | Notes |
|---|---|---|---|---|
| Q1 2024 | 0.110–0.120 | 0.115 | 0.30–0.32 | Post-2023 inventory correction stabilizing |
| Q2 2024 | 0.100–0.110 | 0.105 | 0.28–0.31 | AD/CVD petition filed April 24; bifacial exclusion revoked |
| Q3 2024 | 0.092–0.100 | 0.095 | 0.27–0.30 | Section 301 cell rate doubled August 1 |
| Q4 2024 | 0.085–0.092 | 0.088 | 0.26–0.29 | Preliminary CVD (Oct) and AD (Nov) determinations |
The spread between global spot prices and U.S. delivered prices — roughly a factor of three by year-end — is the direct arithmetic of the tariff stack: Section 201 safeguard duties, Section 301 duties where applicable, antidumping and countervailing deposits on Southeast Asian product, plus freight and distribution margin. For project developers, the practical consequence was that U.S. module procurement in late 2024 priced in a policy risk premium that global benchmarks did not reflect.
Installer note (Portlandia Electric Supply sales desk): "In June and July we fielded a wave of calls from contractors who had quoted projects with bifacial panels assuming the old exclusion. Once the proclamation landed in May, every bifacial quote had to be repriced with the 14.25 percent safeguard added. Our advice all summer was the same: confirm the tariff treatment in writing before locking a bid, and keep a domestic or tariff-exposed alternative priced side by side. The contractors who dual-sourced their BOMs — one commercial panel option imported, one domestic — were the ones who did not have to renegotiate contracts in October."
Storage Cost Parity: The $/kWh Record
BloombergNEF's annual battery price survey, published in December 2024, recorded an average global lithium-ion battery pack price of $115 per kilowatt-hour for 2024, a 20 percent decline from the 2023 average of $139 per kilowatt-hour. It was the largest single-year percentage drop since 2017 and brought the cumulative decline from the 2013 survey baseline of $780 per kilowatt-hour to roughly 85 percent. Within the Chinese market, lithium iron phosphate (LFP) cell prices for stationary storage applications fell below $60 per kilowatt-hour at points during the year, and some utility-scale turnkey container prices in Asia approached levels that made four-hour storage competitive with new gas peaker capacity on a levelized basis in favorable markets.
| Year | Lithium-ion Pack Price ($/kWh, BNEF survey) | Year-over-Year Change |
|---|---|---|
| 2019 | $156 | -13% |
| 2020 | $137 | -12% |
| 2021 | $141 | +3% (commodity inflation) |
| 2022 | $151 | +7% (lithium price spike) |
| 2023 | $139 | -8% |
| 2024 | $115 | -20% |
The phrase "storage cost parity" entered mainstream industry usage during 2024 to describe two distinct thresholds. The first is cell-to-module parity: LFP storage cell pricing fell to rough parity with the per-watt cost trajectory of solar modules, meaning a kilowatt-hour of storage capacity in 2024 cost approximately what a comparable unit of generation capacity cost only a few years earlier. The second is dispatch parity: in high-penetration markets such as California and Texas, solar-plus-four-hour-storage bids routinely cleared capacity and energy auctions at prices competitive with conventional peaking resources. The record 12.3 GW of storage installed in 2024 reflects both thresholds being crossed.
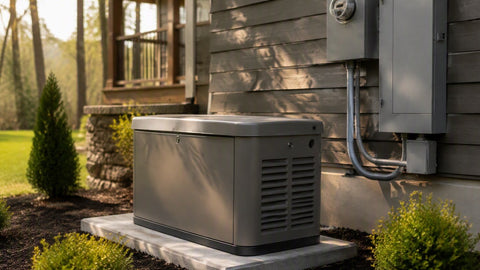
For residential and small commercial buyers, the pack-price decline translated into slower but still visible reductions in installed system pricing, since inverter, racking, labor, and permitting costs do not fall with cell prices. Buyers evaluating storage sizing can use our battery sizing calculator and the home battery bank sizing guide, and can compare chemistry options across our LiFePO4 battery catalog. For larger projects, our energy storage systems and containerized MWh-scale BESS categories reflect the utility-scale segment where 2024's cost declines were most pronounced.
Installer note (field operations): "By the fourth quarter we were quoting 5 kWh LFP server-rack modules at retail prices that matched what 3 kWh units sold for in 2022. Customers noticed. The conversation shifted from 'is a battery worth it' to 'how many batteries do I need' — our energy storage explainer and off-grid storage sizing guide were two of our most-read pages in Q4. The math on self-consumption in California and backup value in Texas genuinely changed during the year."
Interest Rates and Project Finance
The Federal Open Market Committee held the federal funds target range at 5.25–5.50 percent — the peak of the 2022–2023 tightening cycle — for the first eight and a half months of 2024. The easing cycle began on September 18, 2024 with a 50-basis-point cut, followed by 25-basis-point cuts on November 7 and December 18, ending the year at a target range of 4.25–4.50 percent.
| Date | FOMC Action | Federal Funds Target Range |
|---|---|---|
| January–July 2024 | Hold (six consecutive meetings) | 5.25–5.50% |
| September 18, 2024 | -50 bps | 4.75–5.00% |
| November 7, 2024 | -25 bps | 4.50–4.75% |
| December 18, 2024 | -25 bps | 4.25–4.50% |
The effect on project finance was concrete. For most of the year, tax equity, construction debt, and residential loan products all priced off a base rate above 5 percent. A typical residential solar loan carried an effective annual percentage rate in the 6–9 percent range for well-qualified borrowers, and dealer fees on loan products remained elevated, raising the principal financed on many residential systems. On the utility-scale side, every 100 basis points of base rate moves a project's levelized cost of energy by roughly $3–5 per megawatt-hour depending on leverage, so the full 2024 easing cycle of 100 basis points was meaningful but arrived too late to change the economics of projects that reached financial close in the first three quarters. Development pipelines showed the lag clearly: interconnection queues held more than 2,600 GW of generation and storage capacity at year-end according to Lawrence Berkeley National Laboratory, and much of the 2025–2026 build-out was financed under term sheets written while rates were still at peak.
Homeowners and small commercial buyers evaluating the financing side can model scenarios with our solar ROI calculator and review current incentive stacking on the solar incentives by state page. System designers can pair those economics with the solar system size calculator and the appropriate hybrid inverter for storage-ready designs.
Election Year: The Documented Policy Record
The 2024 federal election was held on November 5, 2024. This retrospective records only the documented, factual intersections between the election calendar and the solar market, without commentary on any candidate or on the political merits of any policy.
Three measurable market behaviors tracked the election calendar. First, procurement pulled forward: import data showed elevated module arrivals in the third and fourth quarters as buyers sought to take delivery ahead of both potential trade-remedy outcomes and potential policy changes in 2025. Second, the corporate tax equity market remained fully subscribed throughout the year; the Investment Tax Credit at 30 percent, the 10 percent domestic content bonus, the 10 percent energy community bonus, and the transferability provisions enacted in 2022 were all operative law throughout 2024, and no element of the Inflation Reduction Act's clean energy tax provisions changed during the year. Third, state-level policy continued to move independently of the federal calendar: California's Net Billing Tariff completed its first full year, and several states adjusted interconnection and incentive rules on their own schedules.
Domestic manufacturing policy produced documented results during the year as well. SEIA reported that announced U.S. module assembly capacity passed roughly 31 GW of annual nameplate capability during 2024, with new facilities commissioned in multiple states and several cell manufacturing announcements advancing toward construction. Buyers seeking domestic product for domestic content bonus qualification can browse our USA-made panel collection and our utility-scale panel catalog.
Installer note (commercial desk): "The week after the election our commercial pipeline did not shrink — it accelerated. Customers who had been waiting to see the outcome signed in November and December, and the consistent message was that the 30 percent ITC was law, the projects penciled, and waiting another year cost more than it saved. We directed every customer to verify their incentive stack on our incentives page and to get financing pre-qualified before year-end."
What 2024's Numbers Mean Going Forward
The 2024 record establishes three durable baselines. On trade, the tariff stack at year-end — 14.25 percent Section 201 safeguard (stepping to 14.0 percent in February 2025 and expiring February 2026), 50 percent Section 301 on Chinese cells, and preliminary AD/CVD deposits on four Southeast Asian countries with final determinations scheduled for 2025 — defines the price floor for imported hardware. On storage, a $115 per kilowatt-hour global pack benchmark with LFP cells below $60 per kilowatt-hour resets every cost model written before 2024. On finance, a federal funds rate 100 basis points below peak but well above the 2021 lows defines the cost-of-capital environment in which the 2025 build-out will be financed.
Portlandia Electric Supply tracks these figures continuously across our module, battery, and inverter catalogs. Contractors and project developers can request volume pricing and freight quotes through our commercial procurement page, and homeowners can start with the solar system calculator.
Frequently Asked Questions
What tariff rate applied to imported solar panels in 2024?
Imported crystalline silicon solar cells and modules were subject to the Section 201 safeguard tariff at 14.75 percent through February 6, 2024, stepping down to 14.25 percent on February 7, 2024. Bifacial modules, previously excluded, became subject to the same 14.25 percent rate in June 2024. Chinese solar cells additionally faced a Section 301 tariff that doubled from 25 percent to 50 percent effective August 1, 2024.
How much did battery storage costs fall in 2024?
BloombergNEF's December 2024 battery price survey recorded an average global lithium-ion pack price of $115 per kilowatt-hour, down 20 percent from $139 per kilowatt-hour in 2023 — the largest single-year percentage decline since 2017. LFP cell prices in China fell below $60 per kilowatt-hour at points during the year.
How much solar capacity did the United States install in 2024?
Approximately 50 GWdc, according to the SEIA and Wood Mackenzie U.S. Solar Market Insight Year in Review, up about 21 percent from 2023's roughly 40.4 GWdc. Solar represented about 66 percent of all new U.S. electricity generating capacity added during the year. Energy storage installations reached a record of roughly 12.3 GW and 37.1 GWh.
How did interest rates affect solar project finance in 2024?
The federal funds target range stayed at its 5.25–5.50 percent peak until the Federal Reserve cut 50 basis points on September 18, 2024, followed by 25-basis-point cuts on November 7 and December 18, ending the year at 4.25–4.50 percent. Because most 2024 financial closes occurred before the easing cycle, elevated base rates raised loan APRs on residential systems and lifted levelized costs on utility-scale projects throughout most of the year.
What happened with the Southeast Asia antidumping and countervailing duty case in 2024?
Petitions covering Cambodia, Malaysia, Thailand, and Vietnam were filed April 24, 2024. The Department of Commerce initiated investigations May 15, announced preliminary countervailing duties on October 1 (rates from 0.14 percent to about 292.61 percent), and announced preliminary antidumping duties on November 29, 2024 (rates from 0 percent to 271.28 percent at the Vietnam-wide rate). Final determinations were scheduled for 2025.
When do the Section 201 solar safeguard tariffs expire?
The safeguard tariff schedule runs at 14.25 percent through February 6, 2025, steps down to 14.0 percent for the final year, and the measure expires February 6, 2026 under the 2022 extension proclamation.