2025 H1 Solar Industry Retrospective: Policy Shifts, NEC 2026 Prep, and Market Consolidation
PES Supply market desk · ~16 min read · Sources: SEIA/Wood Mackenzie Solar Market Insight Q2 2025, NFPA, EC&M
The first half of 2025 was the kind of six-month stretch that ages an industry. Tariff rates swung by triple digits in a single quarter, the residential tax credit spent weeks on the legislative chopping block, the NFPA published the 2026 NEC, and the residential segment contracted while commercial set a record. For contractors buying equipment, the lesson of H1 wasn't any single headline — it was that procurement strategy had become a competitive skill. The shops that diversified suppliers and locked pricing early bought cheaper than the shops that didn't. This retrospective walks the numbers and what we think they mean for buying decisions through the rest of the decade.
One framing note: we sell equipment, so our lens is procurement and installation economics, not policy advocacy. Where the data is solid — SEIA/Wood Mackenzie's Q2 2025 Solar Market Insight is the backbone here — we cite it. Where we're interpreting, we'll say so.
The headline number: 10.8 GWdc installed in Q1 2025, down 7% year-over-year and down 43% from an enormous Q4 2024. Context matters — Q4 2024 was inflated by safe-harboring ahead of anticipated policy changes, so some of that 43% drop was calendar math, not demand destruction. Even with the decline, Q1 2025 ranked as the fourth-largest quarter in industry history, and solar accounted for 69% of all new electricity-generating capacity added to the US grid.
| Segment | Q1 2025 Installed | Year-over-Year Change | Read |
|---|---|---|---|
| Utility-scale | 9.0 GWdc | −7% | Interconnection queues and tariff timing, not demand |
| Residential | 1,106 MWdc | −13% | Rates + ITC uncertainty + financing costs compounding |
| Commercial | 486 MWdc | +4% | Record Q1; California NEM 2.0 pipeline still commissioning |
| Community solar | 244 MWdc | −22% | Policy-dependent segment, hit by state-level program pauses |
Texas led all states with 2.7 GWdc installed; California kept the residential lead at 255 MWdc. The geographic detail matters for equipment buyers: growth concentrated in ERCOT-style markets with fast interconnection and cheap land, which pulled demand toward large-format modules and tracker-scale hardware while the rooftop segment cooled.
The segment divergence deserves a beat of its own, because it changed what distributors like us stocked. Utility-scale's 9.0 GWdc quarter, even in a down year, sustained demand for 600W+ large-format bifacial modules and central-inverter-class hardware. Residential's 13% contraction, by contrast, showed up in our order flow as smaller average system sizes and a longer sales cycle — homeowners quoted in March were signing in June, if they signed at all. Commercial's record quarter was the sleeper story: the California NEM 2.0 pipeline kept commissioning, and mid-market installers who had diversified into C&I rooftops found themselves with steadier pipelines than the pure residential shops. If your book of business was 100% residential going into 2025, H1 was a rough six months; the survivors we supply were already splitting their crews across segments.
The most consequential development of the half came on May 22, when the House passed a budget reconciliation bill proposing to eliminate the residential solar tax credit (Section 25D) for both customer-owned and third-party-owned systems starting in 2026, alongside stringent construction-start deadlines for Section 48E commercial projects — construction beginning within 60 days of enactment, placed in service by end of 2028.
The market reacted before anything became law. SEIA downgraded the five-year residential outlook by 9% in the Q2 report, citing the compounding headwinds: high interest rates, consumer economic uncertainty, tariffs, and credit availability. For contractors, the operational lesson was about safe-harboring and quote discipline — customers who signed in H1 with equipment secured early were insulated from both the price swings and the policy risk, while "wait and see" buyers absorbed both.
An executive order prioritizing coal, oil, gas, and uranium — while pointedly excluding solar, wind, and storage from the favored "energy resources" definition — signaled the direction of federal priority even where statute hadn't yet changed. Elections have procurement consequences; H1 2025 made that concrete.
The mechanics of the tax-credit fight mattered as much as the headline. The House language's 60-day construction-start window for Section 48E was aggressive to the point of being nearly unworkable for anything but shovel-ready projects — which was precisely the point, and precisely why every commercial developer we work with spent May and June pulling engineering, interconnection, and equipment commitments forward. Safe-harboring equipment under the start-construction rules became the dominant conversation in our commercial quoting queue: transformers, switchgear, and module orders placed in Q2 were as much about establishing construction-start facts as about the hardware itself. Whether you agreed with the policy direction or not, the rational response was the same — document early, buy early, and don't leave your project's eligibility resting on a floor vote.
No retrospective of H1 2025 is complete without the trade timeline, because it drove real price and availability changes in our own purchasing:
| Date | Action | Procurement Impact |
|---|---|---|
| March 4 | 25% tariffs on Canada/Mexico imports (10% on Canadian energy/minerals) | Inverter and tracker component costs ticked up |
| April 2 | "Liberation Day": universal 10% plus country-specific 10–49% | Broad cost pressure across import categories |
| April 9 | 90-day pause on most reciprocal tariffs | Temporary relief; quoting windows got shorter |
| April 12 | China rate peaked at 145% combined | Chinese-origin components effectively priced out |
| April 20 | AD/CVD final determination on Cambodia/Malaysia/Thailand/Vietnam: 14.64%–3,500% | CMTV module imports collapsed from 3.8 GW/month (2024 avg) to 1.1 GW/month in Q1 |
| May 12 | 90-day China rollback to 30% combined | Partial normalization; scramble for container slots |
| June 4 | Section 232 aluminum raised to 50% | Module frame and racking costs up — the quiet tariff that hit every BOM |
The import-pattern shift was dramatic: Cambodia's module volume went to zero as respondents withdrew from the AD investigation, while Indonesia and Laos grew to a 34.6% share of imports in Q1. For buyers, the actionable takeaway was origin diversification. A module brand isn't a supply chain; the factory behind it is. We adjusted our own stocking accordingly, and our Q3 2026 catalog update reflects the diversified brand bench that came out of this period.
Two procurement behaviors defined the quarter on the ground. First, quoting windows collapsed: prices that used to hold for 30 days were holding for 7-14, because no distributor could responsibly honor a month-old quote when the tariff line could move 25 points overnight. Contractors who kept their customers warm with "price valid through" discipline preserved margin; the ones quoting stale numbers ate the difference. Second, container-slot scarcity became a real factor after the May 12 China rollback — everyone tried to move product in the same 90-day window, and ocean freight rates spiked accordingly. Buyers with standing inventory relationships got allocation; spot buyers waited. I watched two nearly identical commercial jobs price out $0.06/W apart in the same week purely because one had secured freight in April and the other hadn't. That gap is the supply chain made visible.
| Segment | Q1 2025 System Price | YoY Change | Note |
|---|---|---|---|
| Residential | $3.36/Wdc | +3% | Financing and customer-acquisition costs dominate |
| Commercial | $1.47/Wdc | −2% | BOS and labor competition absorbed module increases |
| Utility fixed-tilt | $1.18/Wdc | −1% | Scale economics intact |
| Utility tracking | $1.23/Wdc | Flat | Tracker premium stable |
Module prices rose 2–5% across segments, yet commercial and utility system prices fell or held. The gap closed in the balance of system and in competitive labor. That's the quiet story of H1: the industry's cost structure has matured enough to absorb a trade war in its most-tariffed component without repricing the whole system. For contractors, it meant margin pressure came from module line items, not from the system price ceiling — which is exactly where multi-brand sourcing flexibility pays. Residential was the exception, and the reasons were structural (financing costs, sales overhead) rather than equipment-driven.
The absorption mechanics are worth understanding because they'll matter again. Inverters and BOS components — string inverters, charge controllers, racking hardware — had less tariff exposure than cells and modules through most of the half, so those line items stayed stable while modules moved. Labor competition in the commercial segment, meanwhile, did real work: with residential crews available, commercial installers could staff projects without the wage premiums of the 2023-2024 boom. The result was a system price that looked calm on the surface while its components were anything but. Contractors quoting from last year's price lists discovered the divergence the hard way — module line items had to be repriced weekly while labor assumptions could finally relax.
The US added 8.6 GW of module manufacturing capacity in Q1, reaching 51 GW total — a genuinely historic buildout. ES Foundry's 1 GW cell factory in South Carolina, opened in January, made it only the second domestic cell producer. The honest caveat: upstream capacity (polysilicon, wafers) saw no new additions in the quarter, meaning "domestic module" often still means imported cells assembled stateside. For buyers, domestic assembly is nonetheless meaningful for tariff insulation and AD/CVD exposure, and the domestic content bonus credit math makes origin documentation worth requesting on every commercial quote.
The domestic content bonus deserves its own paragraph because the arithmetic changed project economics in H1. A 10-percentage-point ITC adder on a commercial project is often the difference between penciling and not penciling — but qualifying requires documented domestic content percentages under the adjusted percentage rules, and "assembled in the USA" alone doesn't get you there. Developers who treated origin documentation as an afterthought found themselves re-papering BOMs at the financing stage. The practical move we saw from the sharpest EPCs: request manufacturer cost-breakdown letters at quote time, not at contract time, and keep two qualified BOM variants — one optimized for price, one optimized for the bonus — so the financing model can choose. With 51 GW of nameplate module capacity now stateside, supply for bonus-qualifying builds is no longer the bottleneck; paperwork discipline is.
The NFPA published the 2026 NEC during H1, and the correlating committee's reorganization — begun in 2023, targeted for completion in 2029 — moved forward with real consequences: Article 220 load calculations relocating to new Article 120, five new articles for installations over 1,000V AC / 1,500V DC, and TIA 1835 revising 690.12(C) rapid-shutdown initiation rules (readily accessible, outdoor for dwellings). Our full field breakdown is in the NEC 2026 top-10 changes guide, and the permitting implications are in the AHJ and inspection guide. The H1 lesson: the shops that started template updates at publication had a two-year runway before enforcement; the shops waiting for their state to adopt will be revising plan sets in a panic.
SEIA described residential solar's H1 as "unprecedented turmoil," and the installer consolidation that followed was visible from where we sit: fewer residential dealers, more volume through survivors, and a financing-driven flight to quality. The base-case outlook from Wood Mackenzie projected a 2% annual industry contraction from 2025–2030 — declines of ~7% in the near term (2025–2027) recovering to ~3% growth in 2028–2030.
The wildcard cutting the other way: data centers. Wood Mackenzie tracked nearly 140 GW of proposed data-center load, up from roughly 50 GW a year earlier, with AI-driven electricity demand and gas-turbine supply shortages positioning solar-plus-storage as the fastest-deployable answer. The base case still averaged nearly 43 GWdc of annual additions through 2030 — over 250 GWdc cumulative. Contraction in the near term, structural growth behind it. Contractors who survived the residential shakeout into the commercial and storage segments were positioning for exactly that turn.
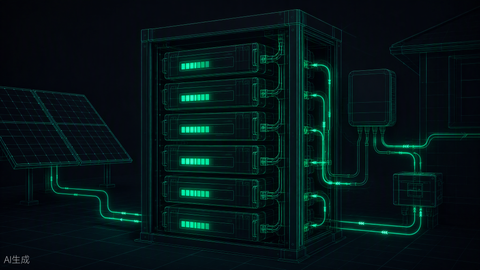
If one product category walked out of H1 2025 stronger than it walked in, it was storage. The policy turbulence that squeezed residential solar margins simultaneously made batteries easier to sell: every conversation about tax-credit expiration ended with "get the system in now," and every conversation about tariff-driven module pricing ended with "the battery economics still work." More fundamentally, the grid-stress story that had been abstract for years became concrete — interconnection constraints, curtailment risk, and time-of-use rate restructuring all push project value toward dispatchable capacity.
| Storage Driver | H1 2025 Signal | Contractor Implication |
|---|---|---|
| Residential attach rates | Climbed steadily; storage increasingly quoted by default in California and high-TOU markets | Quote storage on every residential proposal, not as an upsell |
| Commercial + utility storage | Paired storage became the default interconnection strategy in congested queues | Battery-ready designs win projects that solar-only designs can't interconnect |
| Data-center adjacency | 140 GW of proposed load created demand for firm, fast capacity | Solar-plus-storage is the only clean resource deployable on data-center timelines |
| Equipment supply | LFP cell pricing remained soft; domestic battery assembly announcements accelerated | Rack batteries and integrated ESS pricing held stable while modules moved |
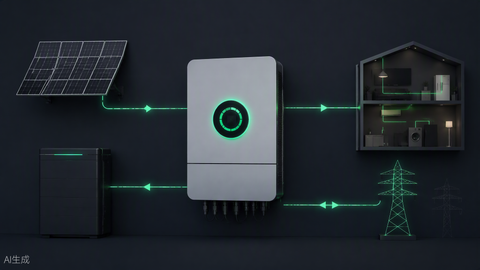
From our side of the counter, the shift was visible in the mix: lithium battery and hybrid-inverter line items grew as a share of residential orders every month of the half, and the storage category stopped being the add-on and started being the anchor. The contractors who built storage competency in 2023-2024 — commissioning fluency, rapid-shutdown integration, backup-load panel design — harvested that investment in H1. The ones still treating batteries as exotic found themselves explaining to customers why the competitor's proposal included one.
Retrospectives are only useful if they sharpen the forward view. Walking out of H1, four questions defined the rest of 2025 — and the same questions frame buying decisions as you read this:
| Open Question | What Would Settle It | What We Were Watching |
|---|---|---|
| Does the reconciliation bill's solar language survive the Senate? | Final enacted text on 25D and 48E timelines | Safe-harbor guidance and Treasury implementation rules |
| Do tariff pauses hold or snap back? | The 90-day windows expiring in July and August | CMTV import volumes and Indonesia/Laos capacity announcements |
| Does residential stabilize? | Two consecutive quarters without a downward revision | Financing rates, installer consolidation pace, attach rates |
| How fast does data-center demand convert? | Signed PPAs and executed interconnection agreements, not proposals | Hyperscaler procurement announcements and gas-turbine lead times |
Our read then, and it aged reasonably well: policy risk would resolve toward some form of phasedown rather than cliff, tariff uncertainty would remain a permanent feature of quoting rather than a passing storm, residential would bottom before it recovered, and data-center load would pull commercial-scale solar-plus-storage forward faster than the interconnection queues could process it. None of that required optimism — it required believing the load-growth math, which at 140 GW of proposed data centers was not a sentiment.
For procurement, the H2 posture we recommended was boring and effective: lock pricing early on anything with a Chinese or CMTV exposure, keep a domestic-assembled module option quoted in parallel, treat storage as standard scope, and hold quote validity windows short with honest expiration dates. The contractors who ran that playbook told us in Q4 that H2 felt manageable. The ones who didn't described the same six months as chaos. Same market, different preparation.
- Safe-harbor where the math works. With 25D and 48E under threat, equipment purchased early carried both price and policy insulation.
- Diversify module sourcing. CMTV restrictions made single-origin supply chains a risk factor. Our panel catalog — Qcells, JA Solar, REC, Trina, domestic-assembled lines — exists so one trade action can't stall your pipeline.
- Prep for NEC 2026 before adoption. Templates, label schedules, and citation blocks updated at leisure instead of under a correction notice.
- Budget the aluminum tariff. 50% Section 232 on aluminum is a racking and frame line item — visible in every commercial BOM.
- Watch the storage attach rate. Data-center demand and grid stress pushed solar-plus-storage from premium option to default expectation in H2 quoting.
H1 2025 punished passive procurement and rewarded preparation. The contractors who came through strongest treated supply chain as strategy: diversified origins, early pricing locks, code-cycle readiness, and one-PO sourcing through distributors holding deep authorized inventory. That's the model PES Supply runs — 50,000+ SKUs from 169 authorized brands across panels, inverters, storage, and generators, delivered in 7–10 business days. Send us your BOM and we'll price it against the current market, not last quarter's.
How much solar did the US install in Q1 2025?
10.8 GWdc, per the SEIA/Wood Mackenzie Solar Market Insight Q2 2025 report — down 7% year-over-year but still the fourth-largest quarter on record. Solar represented 69% of all new US electricity-generating capacity added in the quarter.
What happened to the residential solar tax credit in 2025?
On May 22, 2025, the House passed a budget reconciliation bill proposing to eliminate the Section 25D residential credit for both customer-owned and third-party-owned systems starting in 2026, with strict construction-start and in-service deadlines for Section 48E commercial projects. The policy uncertainty alone drove a 9% downgrade to the five-year residential outlook.
How did the 2025 tariffs affect solar module supply?
AD/CVD final rates of 14.64%–3,500% on Cambodia, Malaysia, Thailand, and Vietnam collapsed CMTV module imports from a 3.8 GW/month 2024 average to 1.1 GW/month in Q1 2025. Import share shifted to Indonesia and Laos (34.6% combined), and module prices rose 2–5% across segments while aluminum tariffs at 50% raised racking and frame costs.
Is the solar industry growing or shrinking?
Both, depending on the horizon. Wood Mackenzie's base case projected near-term contraction (~7% annually, 2025–2027) followed by recovery (~3% growth, 2028–2030), averaging nearly 43 GWdc of annual additions through 2030. Data-center demand — nearly 140 GW of proposed projects — is the structural growth driver behind the recovery.
What should contractors do to prepare for NEC 2026?
Update design templates, label schedules, and plan-set citations at publication rather than at state adoption; verify component listings (UL 3741, UL 1741 SB, UL 9540) match the referenced standards; and train design staff on the Article 690/705/706 changes before the first 2026-edition plan check lands.