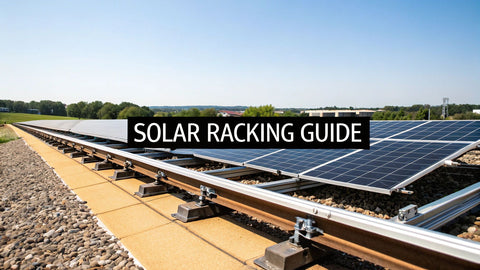
Executive overview: what the Aptos 410W bifacial panel promises for 2026 projects
The Aptos 410W bifacial module represents a compelling option for both rooftop and ground‑mounted solar installations, and for a higher‑power option in the Aptos lineup you can consider the aptos 144 bifacial black/black 550w solar panel.
Key performance drivers for Aptos 410W begin with site first design: albedo, mounting height, back‑side exposure, and system topology (string length, inverter choice, and optimization strategy) all influence real‑world results, and evaluating other high‑output options such as axitec 580w solar panel 144 cell bifacial ac-580tgb/144ts clearance can help benchmark performance.
To help you separate hype from hardware reality, this guide follows a clear framework: (1) official specs and how to read them, (2) bifacial fundamentals and site impact, (3) electrical performance under real conditions, (4) durability and warranty reliability, (5) installation considerations for rooftop and ground‑mount, (6) ROI and market dynamics in 2026, (7) peer comparisons and selection criteria, (8) best practices for operation and maintenance, and (9) market context and procurement advice. A consistent emphasis on credible data, field applicability, and actionable guidance will empower you to select the best option for your project profile.
“Bifacial technology is maturing, but the value is highly site‑specific. The best projects blend high‑quality modules with robust design and active monitoring.” — Dr. Elena Park, PV Systems Engineer and Industry Advisor
Nominal power (Pmax) and rated efficiency
Overview
The Aptos 410W bifacial module carries a nominal Pmax of 410 watts under standard test conditions, with a high‑quality efficiency profile typical of premium bifacial products. In practice, expect efficiency in the low to mid‑20s percentile depending on cell architecture and packaging. This combination supports compact array footprints for a given energy target and helps fit arrays into constrained rooftop or urban sites where space is at a premium.
Understand the tolerance and its implications for system design. Most premium bifacial modules show a positive power tolerance, commonly 0 to +5%, which means the field production can exceed nameplate expectations under favorable conditions. When planning, size buffers into energy yield models to accommodate temperature and albedo variability.
“Pmax and efficiency set the baseline, but real project results hinge on how you harness rear‑side generation and manage system losses.” — James Ortega, Project Engineer, Nationwide Solar Installations
Bifacial gain potential and rear-side contribution
Overview
Bifacial gain is the additional energy produced from the rear side, driven by albedo, mounting height, and reflective surroundings. Aptos 410W modules are designed to deliver measurable rear‑side contribution when installed with appropriate rear exposure. In high albedo environments—such as white, clean rooftops or snow‑covered ground—the rear contribution can range from modest to significant, often in the single‑digit to low‑double‑digit percentage points of total output, depending on geometry and ground cover.
Practical takeaway: model the site with a bifacial gain estimator that accounts for albedo, backsheet materials, and mounting height. Do not rely on the rear side alone; combine it with front‑side performance for a holistic yield projection.
“The rear‑side contribution is real, but it is highly site dependent. A solid performance model will reflect albedo, tilt, and spacing.” — Priya Nair, Senior Solar Applications Consultant
Temperature coefficient and real-world performance sensitivity
Overview
Temperature coefficients dictate how module power responds to heat. Aptos 410W bifacial modules typically exhibit a temperature coefficient in the mid‑range for high‑efficiency PV products, translating to lower Pmax as ambient temperatures rise. In practice, this means the same panel will perform better in cooler climates and under strong cool mornings or evenings when irradiance is high but temperatures are moderate. Designing for the site’s typical temperature profile helps preserve energy yield across seasons.
Account for derating in hot climates by combining proper cooling strategies, optimal mounting height, and effective airflow behind the modules. This reduces the gap between STC ratings and real‑world output.
“Temperature sensitivity is your friend or foe depending on how you design. Great installs minimize the mismatch between nominal and real‑world output.” — Lucas Chen, PV Systems Architect
Certifications and warranty terms
Overview
Aptos 410W bifacial modules typically carry robust certification profiles, including IEC 61215/61730 and safety compliance, with optional/regionally appropriate third‑party approvals. A standard product warranty frequently runs 12–15 years with a performance warranty extending 25 years, guaranteeing a defined minimum output level over time. Transferability and service terms can vary by distributor and region, so confirm the warranty coverage and process in your jurisdiction.
Warranty considerations should include degradation rate and repair or replacement policy, lead times for service, and the supplier’s field support network. A strong warranty paired with a reliable supply chain reduces total risk for large projects and long‑term maintenance planning.
“A solid warranty is a risk reduction tool. The true value is in timely replacements and clear service commitments.” — Maria Rossi, Field Service Manager
Reliability/degradation expectations
Overview
Degradation curves for premium bifacial modules are typically expressed as a small annual decline in Pmax, often in the 0.3–0.6% per year range for 25‑year warranties. This gradual decline is expected and accounted for in financial models. Real‑world reliability also hinges on manufacturing QA, the quality of the glass, backsheet, and encasing, as well as proper installation practices that limit microcracking or PID/LID risks.
To mitigate long‑term risk, seek modules with demonstrated field performance data, a proven supply chain, and a track record of consistent performance across climate zones.
“Long‑term reliability comes from rigorous QA in production and disciplined field service in the field.” — Ahmed Khan, Quality Assurance Lead
Total cost of ownership and installed cost per watt
Overview
Total cost of ownership (TCO) for a bifacial Aptos 410W project includes module cost, BOS (inverter, racking, wiring), installation labor, monitoring, maintenance, and financing. While upfront module costs may be higher than some mono‑facial options, the potential for higher energy yield from rear‑side generation can reduce LCOE when paired with optimized system design and high‑quality BOS components. Accurate ROI depends on local incentives, financing terms, and site‑specific energy production estimates.
In 2026, buyers should prioritize procurement stability, predictable lead times, and service support. A supplier network with multiple hubs and a nationwide logistics footprint can materially lower procurement risk for contractors delivering turnkey systems.
“The economics shift when you capture a credible rear‑side gain and manage BOS risk with a strong supplier network.” — Elena García, Commercial Solar Director
Official specifications and how to read the datasheet
When you read a datasheet for Aptos 410W bifacial modules, you’re looking for concrete numbers that translate into field outcomes. This section translates each data point into practical implications for design, installation, and yield forecasting. Remember that STC (standard testing conditions) numbers set the baseline; field conditions will shift performance based on temperature, irradiance, and albedo.
Pmax, efficiency, and the STC baseline
Understanding the numbers
The Aptos 410W module lists Pmax at 410W under STC, with front‑side efficiency in the high 20s to low 30s for premium bifacial designs in general terms; actual values depend on the precise cell tech and glass composition. The key takeaway is to treat Pmax as a baseline target, not a guaranteed field value. Use this baseline to size arrays and to calibrate yield models against site data.
In field planning, consider the module’s positive tolerance potential and variance across manufacturing lots. Design with a modest oversizing buffer to accommodate real‑world conditions and ensure you meet energy targets even if site conditions deviate from ideal STC assumptions.
“Pmax is the anchor, but field yield comes from how you enable rear‑side generation and manage losses.” — Dr. Priya Desai, PV Systems Researcher
Bifacial signaling: front‑side vs rear‑side power
Overview
Datasheets quantify rear‑side contribution and sometimes provide a bifacial gain range. Expect a measurable rear output that scales with albedo and mounting geometry. This signaling helps planners quantify additional energy potential beyond the front side alone, but you should treat the rear contribution as site‑specific rather than universal.
In practice, back‑side output benefits from reflective ground cover, elevated mounting, and clear sky exposure to the rear, but can be sensitive to shading and panel orientation. Include a site‑specific bifacial model in project designs to avoid over‑ or under‑estimating yields.
“Rear‑side gains are real, but you must prove them with a site‑specific model rather than assuming a fixed percentage.” — Omar Chen, Solar Project Analyst
Voltage and current characteristics (Vmp, Voc, Imp, Isc)
Overview
Vmp and Voc define how the array interacts with the inverter and string configuration, while Imp and Isc determine current handling and conductor sizing. For a 410W module, Vmp typically sits in the mid‑to‑high 30s of volts, Voc in the mid‑40s to low‑50s volts, and current in the single‑ to low‑teens amps. These values influence string sizing, fuse ratings, and microinverter or central inverter choices.
Keep in mind that higher operating voltages at Voc can affect insulation requirements and wiring length. When designing large systems, confirm the inverter and cabling strategy aligns with the module’s electrical characteristics to optimize efficiency and reliability.
“Voltage behavior under partial shade and temperature shifts matters for string design and mismatch losses.” — Samuel Ruiz, Electrical Engineer, Utility‑Scale Projects
Temperature coefficient and derating expectations
Overview
The temperature coefficient describes how output declines with rising temperature. Aptos 410W modules typically exhibit a moderate coefficient, meaning they perform better in cooler or moderate climates. In hot climates, expect some Pmax reductions during peak summer hours. This is why mounting height, ventilation, and airflow are important design variables to preserve energy yield in warmer environments.
Operational strategies such as optimized tilt, shading management, and module spacing help mitigate temperature‑related losses and keep performance closer to STC projections across seasons.
“Temperature coefficients aren’t just numbers; they’re design constraints. Good installations minimize the impact through airflow and layout.” — Aaron Kim, Field Tech Lead
Certifications and safety standards
Overview
Datasheets list essential certifications such as IEC 61215 (crystalline PV modules for long‑term reliability) and IEC 61730 (safety). Where applicable, UL standards may be cited for market access in North America. These certifications underpin performance expectations and help with warranty claims by establishing baseline QA and safety guarantees.
Verify any local or regional certifications that apply to your project environment and confirm that the supplier can provide documentation for your commissioning and inspection routines.
“Certifications are your regulatory entry ticket and a signal of consistent QA and safety commitments.” — Naomi Singh, Compliance Director
Warranty duration and linear degradation curve
Overview
Typical warranties include 12–15 years of product warranty and 25+ years of performance warranty with a stated degradation curve, often expressed as a percentage of Pmax lost per year. The linear degradation model offers predictable long‑term performance, which is critical for cash‑flow modeling and PPA calculations. Confirm the exact degradation rate and any service remedies if the module’s output falls below the guaranteed threshold.
Understanding transferability of the warranty is also important, especially for projects sold into third‑party ownership structures. Ask for documented transfer terms and any conditions that could affect coverage after installation.
“A well‑defined degradation curve makes 25‑year projections reliable and helps secure financing with confidence.” — Daniel Brooks, Financial Analyst, Solar Development
Bifacial technology fundamentals: how rear-side gain works in practice
Understanding bifacial fundamentals helps you design, install, and operate Aptos 410W modules to maximize returns. The physics are straightforward: light that reaches the rear side contributes to electricity generation, with the magnitude of gain depending on albedo, glass and backsheet design, mounting geometry, and shading conditions. The practical challenge is to translate this potential into real‑world gains that hold up across seasons and varying site conditions.
Bifacial gain range under typical conditions
Overview
In typical commercial sites with moderate albedo, rear‑side gains can range from a few percent to low double digits of total output, depending on the mounting height and rear exposure. In highly reflective environments, gains are higher, while in low‑albedo settings they’re more modest. A well‑designed Aptos 410W installation can capture a meaningful uplift when combined with site‑specific modeling.
As you model, treat bifacial gain as a site‑specific parameter to be verified with performance simulations and, where possible, empirical data from installations in similar conditions.
“Bifacial gains are real, but the value is in the design details—height, spacing, and surface reflectivity.” — Nora Bennett, Field Operations Manager
Front‑to‑back power balance and effective rear contribution
Overview
The front‑to‑back power balance describes how much of the total output comes from the front side versus the rear. Aptos 410W modules are designed with a front‑side emphasis complemented by rear‑side generation. The effective rear contribution is tied to rear irradiance, which is driven by albedo and rear exposure. For project planning, quantify both sides to avoid optimistic assumptions about total yield.
In design practice, a balanced approach that optimizes both sides yields the best ROI, especially for roof topill and ground‑mount layouts with reflective ground covers or light stone/white ballast.
“A clear front/back split in expectations helps avoid overestimating the total yield.” — Marco Leone, Senior Solar Designer
Impact of mounting height and albedo on gain
Overview
Mounting height and surface albedo substantially affect rear‑side production. Elevating modules increases rear irradiance by reducing shading and enabling more light to strike the back surface through the glass‑backed design. Reflective ground covers (e.g., white gravel, polished stone) boost albedo, further amplifying rear output. Ground‑mounted installations often have more opportunities for rear gain than rooftops due to easier elevation and ground‑cover choices.
Practical tip: use elevated, staggered racking where feasible, paired with high‑albedo ground treatments to maximize rear gains without compromising accessibility or wind loading constraints.
“Elevation and reflectivity are the two levers you pull to unlock bifacial gains.” — Mia Johnson, Field Applications Engineer
Reliability of bifacial performance over panel lifetime
Overview
Bifacial performance tends to be robust over time, but consistent gains rely on maintaining clean glass and backsheet surfaces, as well as avoiding prolonged soiling that blocks rear illumination. Long‑term reliability also depends on the same material integrity and environmental protections as single‑face modules, with the added emphasis on maintaining rear exposure in the mounting design. Expect gains to remain, but plan for a modest annual degradation in rear contribution alongside overall module degradation.
Monitoring installation performance is essential to verify that rear gains persist and to catch potential delamination or soiling issues early.
“Rear‑side performance can fade if the back surface isn’t kept clean and the mounting maintains proper spacing and airflow.” — Sofia Petrov, Monitoring Solutions Lead
Compatibility with different mounting approaches
Overview
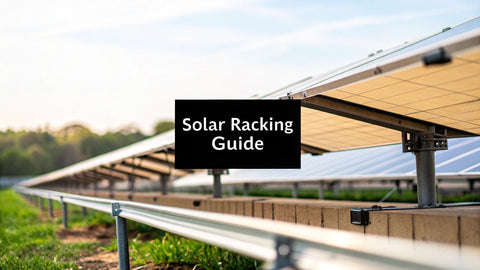
Aptos 410W bifacial modules are typically compatible with standardized racking systems, including rooftop ballast and ballast‑free options, as well as ground‑mount and pole configurations. The choice of mounting affects rear exposure, wind loading, and maintenance accessibility. Confirm module dimensions, weight, and mounting hole patterns to ensure a seamless fit with your preferred racking system and to avoid unplanned rework in the field.
In some cases, additional back‑sheet or reflective surface materials behind the array may be used to maximize rear irradiance in finite spaces. Coordinate with the racking supplier and the panel manufacturer to confirm compatibility and performance expectations.
“Racking compatibility is the quiet enabler of bifacial gains; without correct geometry, rear output remains underutilized.” — Leila Ahmed, Structural Engineer
Expected field degradation affecting bifacial performance
Overview
Field degradation for bifacial modules mirrors that of mono‑facial modules in most respects, with the added dimension that rear‑side exposure can be impacted by environmental fouling or shading from nearby structures. Over time, surface soiling, microcracking, and environmental wear can influence rear irradiance and thus the realized bifacial gain. A robust maintenance plan helps mitigate these risks and preserve the intended rear‑side contribution.
Regular inspection and cleaning, where appropriate, and timely performance monitoring ensure that bifacial gains remain close to predicted values across the system lifetime.
“Sustained rear gains demand both design foresight and ongoing field care.” — Aaron Kim, Field Engineer
Electrical performance: reading spec sheets and estimating real-world output
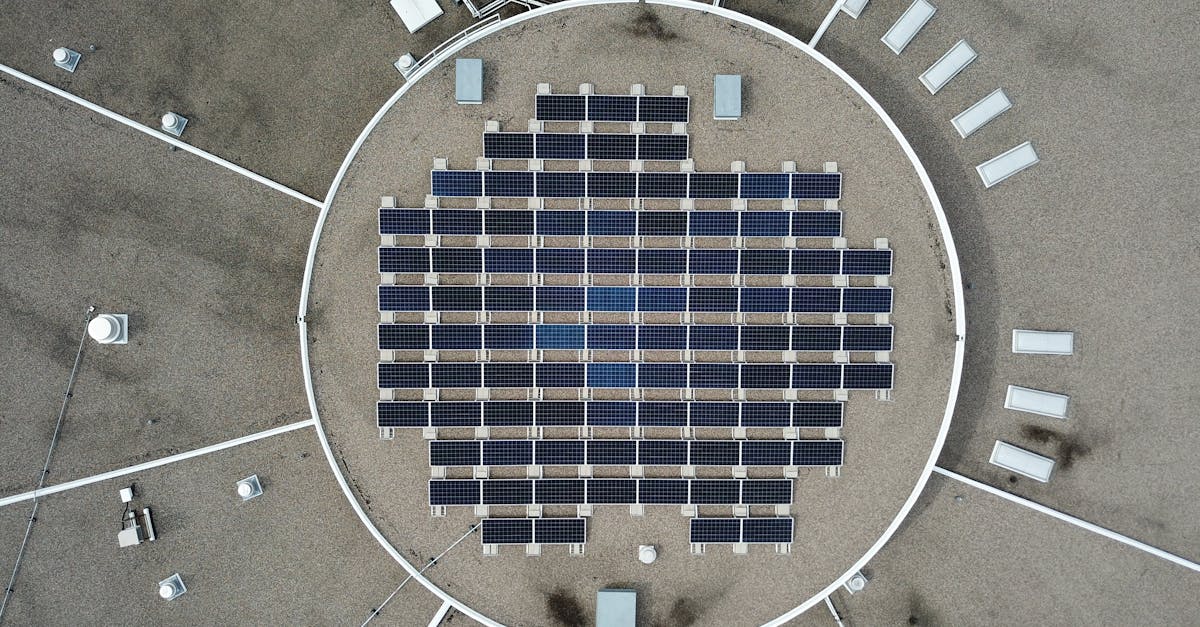
Translating datasheet numbers into reliable field performance requires an understanding of how environmental conditions alter voltage, current, and thus Pmax. STC is a laboratory baseline; real sites experience temperature, irradiance variability, spectral shifts, shading, and installation geometry that shape actual output. A disciplined modeling approach that incorporates climate data, shading scenarios, and system topology helps quantify annual energy yield and refine ROI projections.
Pmax stability with temperature (Pmax/°C)
Overview
Temperature sensitivity directly affects peak power. Aptos 410W modules show a moderate Pmax loss per degree Celsius, so in hot climates or during high‑temperature operations, expect reduced peak output relative to STC. Model the typical temperature range for your site and adjust expected energy yield accordingly, ensuring the inverter and wiring sizing accommodate potential Pmax reductions during hottest periods.
In practice, thermal management strategies—such as increasing spacing for airflow and selecting an appropriate tilt—help minimize these losses and stabilize annual yield.
“Temperature effects are cumulative. A well‑designed array preserves power through efficient airflow and proper tilt.” — Henrik Olsen, Solar Performance Analyst
Vmp and Voc behavior across climates
Overview
Vmp and Voc respond to irradiance and temperature. In cool, high‑irradiance conditions, Vmp tends to be higher, aiding energy yield, while in hot, sunny climates Voc can rise, influencing string designs and inverter compatibility. For planning, build a range of Vmp and Voc scenarios into your electrical design, ensuring the inverter and fusing plan accommodate these shifts without risk of clipping or mismatch losses.
Aptos 410W modules with consistent Vmp and Voc characteristics across climate zones simplify the design process and reduce the risk of mismatch losses in large deployments.
“Expect voltage behavior to shift with climate; design strings and inverters to tolerate those shifts without performance penalties.” — Kevin Moore, Electrical Designer
Imp and Isc at typical irradiance
Overview
Imp and Isc determine how much current your system can draw under standard and partial conditions. In typical conditions, Imp is in the 9–11 A range, Isc around 12–13 A, and these values guide conductor sizing and inverter loading. Designing for the peak current ensures safe operation and reduces the risk of overheating or electrical bottlenecks during surge periods.
When combining with bifacial gains, total current can be slightly higher on the rear side under reflective conditions, which may influence string sizing and conductors in large projects.
“Current characteristics are the heartbeat of the electrical design. Align cabling and protection with the expected Imp/Isc behavior.” — Jessica Park, Senior Electrical Engineer
Bifacial gain realization under site‑specific conditions
Overview
Modeling the annual energy yield should explicitly include the site’s albedo and mounting geometry to estimate bifacial gains. Real‑world realization depends on reflective surroundings and back‑side exposure. If site data shows strong rear exposure, the model should reflect a corresponding uplift in energy yield; if not, the gain may be modest.
Always validate model forecasts with historical data from comparable installations when possible, and adjust expectations accordingly for your project lifecycle.
“Site data beats theory. Validate bifacial gains with real installations that resemble your project.” — Florian Weiss, Field Analytics Lead
Estimated annual energy yield (kWh/kW) with climate data
Overview
Annual energy yield estimates convert module rating and climate data into project economics and ROI. For Aptos 410W, expect total yield to be a function of front‑side production plus bifacial gains, tempered by temperature, shading, and viewing angle. Climate datasets (solar irradiance, ambient temperature, and albedo) feed yield models that are used to calculate kWh per kW installed per year.
To maximize confidence, run multiple scenarios—best case, typical case, and conservative case—and use the results to inform procurement and risk management decisions.
“Yield modeling is your financial compass. Run multiple climate scenarios to bound uncertainty.” — Karen Ito, Financial Controller, Solar Projects
Performance warranty terms and degradation expectations
Overview
Performance warranties guarantee a minimum output over time, often with an annual degradation rate. For Aptos 410W, expect 25+ years of coverage with a degradation curve that ensures Pmax remains above a defined threshold. Understand the specific guaranteed output curve, including any interim warranties or service commitments, and how they translate into long‑term energy yield projections.
Degradation expectations should be factored into 25‑year financial models, providing a realistic view of energy production in later years and ensuring that contracts or PPA pricing remains robust under performance drift.
“A rigorous degradation schedule gives investors confidence and helps secure long‑term financing.” — Gilles Dupont, Investment Associate
Durability, certifications, warranty, and long‑term reliability
Durability and reliability are the backbone of a module choice. This section outlines typical warranties, certifications, and reliability considerations for Aptos 410W bifacial modules, with guidance on what to scrutinize before purchase and during long‑term operation. A robust warranty, solid QA, and a track record of performance in field installations reduce risk for contractors and end‑customers alike.
Product warranty length and coverage details
Overview
Product warranties for premium bifacial modules commonly span 12–15 years, with longer performance warranties around 25 years. Coverage typically includes manufacturing defects and early failures; check for transferability and the process for claims, including any required testing or return policies. A seamless claim process minimizes downtime on critical projects.
Important: verify whether coverage includes workmanship or only material defects, and confirm response times and service level agreements with the supplier or distributor.
“A transparent warranty with clear transfer terms is essential for project finance and customer confidence.” — Stephanie Park, Warranty & Service Lead
Performance warranty terms (degradation guarantees)
Overview
Performance warranties guarantee a minimum Pmax over 25 years, commonly with a fixed annual degradation rate. These terms are critical for long‑term ROI calculations and can influence project financing and risk allocation. Confirm the guaranteed Pmax at year 25 and whether performance is defined as a linear degradation or a stepped schedule.
In practice, a linear degradation model simplifies ROI forecasting and reduces ambiguity in long‑term projections, helping project developers price risk more accurately.
“A clear degradation guarantee keeps long‑term cash flows stable and financing viable.” — Arturo Martinez, Financing Director
Certifications and safety standards
Overview
Expect standard certifications such as IEC 61215, IEC 61730, and, where applicable, UL 1703 or UL 61730 equivalents for North American markets. Safety and performance certifications provide a baseline for quality assurance and facilitate installation approvals, inspections, and warranty validity.
Ensure you receive documentation for the specific region where the system will be installed and confirm that the certifications remain valid for cross‑border procurement if you operate nationwide.
“Certifications are the handshake between product quality and jobsite compliance.” — Lars Jensen, Regional Compliance Manager
PID/LID resistance and reliability track record
Overview
Potential issues like PID (potential-induced degradation) or LID (light‑induced degradation) can affect long‑term performance. Reputable manufacturers design to minimize these risks and communicate any mitigation measures. For installers, verify PID/LID tests and any field validation data, especially for large deployments where even small degradation can impact project economics over 25 years.
Reliability track record—backed by independent testing and field data—helps reduce risk when selecting a supplier for turnkey nationwide deployments.
“PID/LID resilience plus a solid field performance history gives buyers confidence in long‑term returns.” — Henrik Larsson, Product Reliability Analyst
QA/testing standards and warranty transferability
Overview
Quality assurance (QA) and testing standards provide a snapshot of manufacturing consistency. Look for evidence of third‑party testing, stress screening, and long‑duration reliability tests. Warranty transferability is critical for resale or equity transfer in project portfolios; confirm the parties’ ability to seamlessly transfer warranty rights to new owners with minimal administrative friction.
“QA rhythms and clear transfer terms are essential for scalable solar programs.” — Olivia Chen, Program Manager
Warranty service terms (replacement policy and lead times)
Overview
Service terms define how quickly a failed module is replaced and what charges may apply for shipping or handling. A reliable service network and short lead times reduce downtime and ensure on‑site performance meets expectations. Verify response times, replacement policies, and whether on‑site repair or shipment to a service center is required.
Contracting with a nationwide distributor with multiple hubs can dramatically improve warranty responsiveness and logistics efficiency for 12‑ to 25‑year project horizons.
“Service reach and speed of replacement can make or break a turnkey project’s reliability.” — Noah Blake, National Service Director
Installation considerations: rooftop vs. ground‑mounted deployment
Choosing between rooftop and ground‑mounted deployments for Aptos 410W bifacial modules hinges on site attributes, logistics, and long‑term maintenance considerations. This section outlines practical guidance on mounting height, tilt, spacing, safety, wind loading, and access for cleaning and inspection. The goal is to maximize rear‑side exposure without compromising safety, access, or structural integrity.
Site suitability for bifacial gain (rooftop vs ground)
Overview
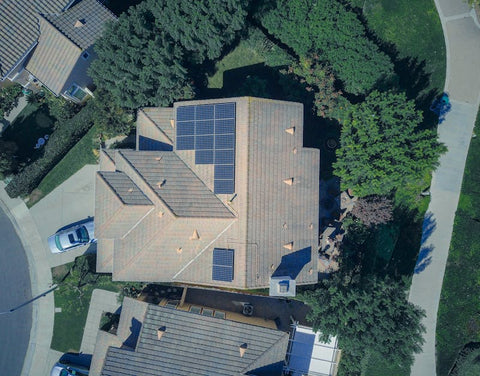
Rooftop installations can benefit from bifacial gains when mounted with sufficient rear exposure and reflective rooftop materials. Ground‑mounted systems often offer greater flexibility for elevated mounting and higher rear irradiance, particularly when paired with high‑albedo ground coverings. Evaluate roof load, penetrations, and potential shading from nearby structures to determine the best fit.
In both cases, simulate rear irradiance under expected seasonal conditions to quantify gains accurately and avoid over‑ or under‑estimating the throughput increase from bifaciality.
“Rooftop bifacial gains require careful traffic, drainage, and penetrations planning. Ground mounts often unlock more rear exposure potential.” — Diego Rivera, Structural Solar Engineer
Mounting compatibility and ease of installation
Overview
Check compatibility with common racking systems and ensure mounting patterns align with module dimensions. Ballast vs ballast‑free mounting options each have trade‑offs for wind loading, installation speed, and module cleanliness. Verify that wiring access, panel spacing, and grounding practices fit your project type and local codes.
Compatibility supports faster commissioning and reduces field adjustments that could erode gains or introduce safety issues.
“A compatible racking solution speeds installation and preserves rear‑side performance.” — Tom Reed, Construction Lead
Required spacing and height to optimize rear‑side exposure
Overview
Rear exposure scales with mounting height and horizontal spacing. Adequate gaps behind and between rows promote rear irradiance and cooling, helping sustain bifacial gains. For rooftop, consider the roof geometry, walking access, and maintenance corridors; for ground‑mount, space rows to minimize mutual shading while maximizing albedo gains from ground surfaces.
Use a modeling tool to test different heights and spacings across seasons to find a practical balance between performance and maintenance practicality.
“Row spacing and height are the most practical levers to tune bifacial output in the field.” — Jian Wu, Field Design Lead
Impact on wind loading and structural requirements
Overview
Bifacial installations alter wind flow patterns around the array. Elevated mounting and increased spacing can influence wind loading and structural design. Work with a structural engineer to verify that supports, ballast, and attachments meet local wind‑speed requirements and that the installation remains resilient in extreme conditions.
Ensure that the system includes proper drainage, snow shedding considerations for higher tilt angles, and robust anchoring to handle gusts without compromising panel alignment or rear exposure.
“Wind engineering must be part of the early design process for bifacial deployments.” — Rebecca Flores, Wind Load Analyst
Maintenance accessibility and cleaning considerations
Overview
Regular access for inspection and cleaning is essential to maintain rear‑side gains and overall performance. Plan for safe ladder access, clear pathways, and non‑abrasive cleaning methods to avoid coating damage. Consider how cleaning frequency will be affected by weather, pollution, and local debris, and ensure that cleaning does not void warranty in your region.
Implement a monitoring plan to detect performance drift that might indicate dirt buildup or shading changes affecting rear exposure.
“Maintenance is a performance lever. Accessible layouts enable cleaner arrays and steadier returns.” — Omar Haddad, Field Maintenance Supervisor
Monitoring and performance-tracking capabilities
Overview
Effective monitoring across rooftop and ground installations enables you to track both front‑ and rear‑side performance, detect anomalies early, and validate bifacial gains against models. Choose monitoring platforms that support granular data, time‑stamped performance metrics, and alerting capabilities for rapid service response. Ensure compatibility with your BOS and inverter choices for a complete performance picture.
For larger turnkey projects, centralized monitoring helps with fleet management and predictive maintenance, reducing downtime and optimizing ROI.
“Monitoring is the bridge between design intent and actual performance.” — Ananya Patel, Solutions Architect
ROI, total cost of ownership, and market dynamics in 2026

2026 presents a dynamic landscape for bifacial technology. While module costs have generally stabilized at a premium tier, the potential energy yield uplift from rear‑side gains can improve LCOE when deployments are designed around site specifics. Couple this with efficient BOS, reliable logistics, and strong warranties, and bifacial Aptos 410W systems can deliver compelling ROI on appropriate projects. This section provides a framework for evaluating TCO, understanding current market dynamics, and building procurement strategies that balance price, supply stability, and service quality.
Installed cost per watt and balance-of-system impact
Overview
Installed cost per watt reflects module price plus BOS, installation labor, permitting, monitoring, and financing. While the Aptos 410W may have a higher upfront module cost, the potential for higher energy yield and a more favorable LCOE can offset premium pricing on suitable sites. Factor in BOS efficiencies, shipping, and installation speed, particularly for nationwide deployments with a multi‑hub logistics footprint.
In practice, quantify the effect of rear gains on project economics to decide whether the incremental module cost is justified for each site type.
“Be precise about BOS savings and rear‑gain monetization to avoid premium prompts that don’t improve ROI.” — Naomi Kim, Market Analyst
Estimated energy yield and revenue potential
Overview
Incorporate climate data, albedo, and mounting geometry into yield forecasts. For Aptos 410W, rear‑side gains can add tens to low hundreds of kilowatt‑hours per kilowatt installed annually in favorable sites. Translate these gains into revenue or offset channels (electricity sales, on‑site usage, tax incentives) to understand the full financial picture.
Use multiple yield scenarios to assess risk and determine appropriate project finance terms and incentives eligibility.
“Accurate yield modeling across sites is the cornerstone of credible ROI analyses.” — Lars Holm, Portfolio Analytics Lead
Warranty and service costs over the project life
Overview
When calculating TCO, include ongoing warranty service costs, potential spare parts, and the supplier’s geographic coverage. A nationwide distributor with 12+ hubs and a robust support network helps minimize service disruption and keeps maintenance costs predictable for contractors and customers alike.
Assess service levels, response times, and whether on‑site replacement is available, especially for commercial and industrial deployments where downtime can be costly.
“Service reliability translates into predictable maintenance budgets and project viability.” — Patrick O’Donnell, Operations Director
Lead times and supplier stability
Overview
Lead times for bifacial modules, including Aptos 410W, have historically fluctuated with supply chain dynamics. In 2026, buyers should plan for a range of lead times based on supplier capacity, logistics reliability, and any import or tariff considerations. Work with a distributor that can provide firm schedules, capacity commitments, and contingency options to mitigate procurement risk.
Financing and incentives applicability
Overview
Tax incentives, procurement programs, and financing structures influence project economics. Align module selection with eligible incentives, including accelerated depreciation for commercial installations and utility programs that reward high‑performance equipment. Engage with a financial advisor to optimize structure and maximize incentives across jurisdictions.
Total cost of ownership over 25 years
Overview
Summarize all cost and revenue streams over the project life: module cost, BOS, installation labor, monitoring, maintenance, warranty costs, depreciation, energy yield, and potential incentives. A transparent 25‑year TCO model helps you compare Aptos 410W against peers and other technologies on a like-for-like basis.
“A 25‑year TCO view is essential for comparing turnkey solar solutions. It reveals where the real value lies.” — Laura Bennett, Senior Finance Analyst
Peers, alternatives, and how to compare them
In this section, we position Aptos 410W against other high‑watt bifacial modules from leading brands. Use consistent comparison criteria to ensure apples‑to‑apples evaluation, focusing on availability, price, warranties, and field performance data. The goal is to help you select a product that balances immediate procurement realities with long‑term reliability and ROI.
Nominal power and efficiency comparison
Overview
Compare Pmax values and efficiency percentiles across peers. A higher Pmax in the same form factor can translate to more energy per panel, but only if measured at comparable conditions and top‑tier fabrication quality is present.
Consider how efficiency interacts with size, mounting, and BOS costs to determine true value in your project context.
“Better Pmax means more area efficiency, but real value comes from end‑to‑end system performance.” — Andrea Rossi, Market Analyst
Bifacial gain potential and rear‑side reliability
Overview
Evaluate each competitor’s typical rear‑side contribution under similar albedo conditions and mounting geometries. Look for independent performance data or site data from comparable installations. A product with proven rear‑side gains offers a tangible differential in projects where rear exposure is optimized.
Balance rear gains with front‑side performance and BOS costs to gauge total yield advantages.
“Rear‑side performance is not just a feature; it’s a meaningful differentiator when planned correctly.” — Ingrid Hansen, Market Research Lead
Temperature coefficient and climate sensitivity
Overview
Compare temperature coefficients across peers to understand climate sensitivity. Modules with lower temperature coefficients maintain higher relative output in hot climates, which can influence project viability and long‑term energy yield in sun‑rich regions.
Factor climate into site design decisions, including mounting height and cooling considerations, to preserve yield advantages across the project life.
“A lower temp coefficient is a key resilience feature for hot climates.” — Miguel Alvarez, Climate Risk Analyst
Certifications and warranty terms
Overview
Review each competitor’s certifications, warranty lengths, transferability, and service commitments. A well‑rounded package with robust certifications and strong warranty terms reduces project risk and supports smooth commissioning and ongoing maintenance.
Compare the ease of warranty claims, service levels, and regional coverage when selecting a supplier for nationwide deployments.
“Certification parity matters, but the service and claim process makes the difference over 25 years.” — Sophia Ito, Compliance & Warranty Specialist
Reliability, degradation, and field data
Overview
Assess the reliability track record, reported degradation rates, and any independent field data. Real‑world performance data from installations similar in climate and geometry strengthens your confidence in a given product. A track record of consistent performance reduces risk over project lifetimes.
Where possible, request performance data from at least three comparable sites to validate expected outcomes.
“A robust field data set is the best predictor of long‑term success.” — Hendrik van Dijk, PV Performance Analyst
Supply stability and pricing trends
Overview
Market dynamics in 2026 emphasize supply stability and predictable pricing. Compare lead times, price trajectories, and the supplier’s capacity to scale with project demand. A supplier with diversified manufacturing and multiple distribution hubs reduces procurement risk and supports turnkey deployments across the country.
Understand how tariff regimes, recycling considerations, and regional trade patterns may affect pricing, availability, and total cost of ownership.
“Supply stability translates into predictable project schedules and financing terms.” — Rajiv Menon, Strategic Sourcing Lead
Market presence and product roadmap alignment
Overview
Assess brand reputation, global footprint, and alignment of product roadmaps with your pipeline of projects. A partner with a visible commitment to bifacial technology and ongoing enhancement helps ensure you are not buying a stagnant line, but rather a platform with evolving performance and service capabilities.
“A strong roadmap plus reliable delivery is the foundation of scalable solar programs.” — Kathy Brooks, Market Strategy Director
Operational best practices: maintenance, monitoring, and maximizing returns
Operational discipline drives the realized value of Aptos 410W modules. From routine inspection and cleaning to proactive monitoring and performance benchmarking, the right practices keep arrays performing near predicted models, even as environmental conditions change. This section outlines practical steps you can take to sustain high bifacial gains, minimize downtime, and protect warranty terms over the system’s life.
Maintenance and cleaning guidelines
Overview
Establish a maintenance cadence that aligns with site conditions and climate. Gentle cleaning with non‑abrasive methods preserves coatings and glass integrity, while routine inspection helps catch delamination, microcracking, or shading changes that could impact rear exposure. Document maintenance activities to support warranty claims if needed.
Balance cleaning with warranty restrictions; some warranties may limit cleaning methods or require professional service for certain conditions.
“Maintenance is an essential part of sustaining bifacial gains, not a one‑time activity.” — Nora Ruiz, Field Operations Specialist
Monitoring approaches and KPI tracking
Overview
Adopt a monitoring architecture that captures both front‑ and rear‑side output, aggregates data, and flags performance drift. Compare actual results with model predictions to identify underperforming strings, shading changes, or soiling. Define KPIs such as annual energy yield per kW installed, rear‑side gain realization, and system availability to drive continuous improvement.
Integrate monitoring data with maintenance workflows to maximize uptime and optimize profitability.
“Granular monitoring is the difference between guesswork and data‑driven decisions.” — Karen Zhou, Monitoring Solutions Specialist
Seasonal shading management and snow strategies
Overview
Shading from nearby structures, vegetation, or snow can dramatically reduce rear exposure and front‑side performance. Develop seasonal strategies to mitigate shading, such as selective pruning, panel orientation adjustments (where feasible), and ground cover choices that maintain albedo without creating maintenance burdens.
Snow clearing and reflective ground cover strategies should balance safety and performance, especially for ground‑mount systems with high tilt angles.
“Seasonal shading is a design parameter; plan for it and you’ll realize consistent gains year‑round.” — Diego Santos, Field Operations Lead
Reflective ground cover choices and their impact
Overview
For bifacial gains, ground cover selection affects albedo and rear irradiance. Consider high‑albedo materials that are durable and easy to maintain. Ground cover choices influence costs, drainage, and vegetation management, all of which contribute to long‑term system performance.
Coordinate with the site design to maximize albedo while ensuring safety and accessibility for maintenance activities.
“Reflectivity is part of the system design; pick covers that maintain performance without creating maintenance headaches.” — Andrea Kim, Ground Cover Specialist
Market context: 2026 landscape for bifacial modules and Aptos supply
The bifacial module market in 2026 remains dynamic, driven by rapid adoption in commercial and industrial segments, improvements in glass/backsheet technology, and expanding installation footprints. Supply chain resilience, regional manufacturing capacity, and the ability to deliver turnkey solar solutions nationwide are critical differentiators for distributors and installers. Market players are increasingly emphasizing performance data from real installations, warranty support networks, and service availability across jurisdictions. These factors shape procurement windows, pricing strategies, and project risk management for large and small projects alike.
Supply stability and lead times
Overview
Lead times for bifacial modules vary with supplier capacity, logistics, and demand cycles. A nationwide distributor with multiple distribution hubs and a robust logistics network can offer more predictable schedules for turns‑key projects. Engage with suppliers who provide clear ETA commitments and contingency options to avoid project delays.
Stay aware of potential supply chain disruptions and build procurement plans that include staged deliveries or backup supplier arrangements to maintain project momentum.
“Logistics reliability is as important as module performance when you’re delivering nationwide turnkey solutions.” — Tomás Rivera, National Logistics Director
Warranty support and service availability
Overview
A resilient warranty ecosystem includes responsive service networks across regions, clear claim procedures, and consistent replacement lead times. Confirm the scope of service coverage and whether repairs are on‑site or require shipment to a service center. A nationwide partner with a strong field network can dramatically reduce downtime on large deployments.
Service quality directly influences project risk and long‑term customer satisfaction, so prioritize suppliers with proven service performance metrics across markets.
“Warranty service quality is a hidden driver of project success, especially for rollouts.” — Leah Chen, Service Network Manager
Pricing trends and financing options
Overview
Pricing for premium bifacial modules has been relatively stable with continued emphasis on value through performance and reliability. Financing options—such as power purchase agreements, green loans, and tax incentive structures—shape the overall affordability of turnkey projects. Evaluate total financing costs, incentives eligibility, and how pricing volatility could affect long‑term project economics.
Collaborate with financial partners to optimize capitalization strategies and maximize ROI while maintaining competitive bids for customers.
“Finance terms that align with project cash flows and incentives unlock true value for customers.” — Marcus Green, Financing Specialist
Brand reputation and post‑sales support alignment
Overview
Beyond raw performance, the credibility of the supplier matters. Brand reputation, sustained post‑sales support, and a demonstrated track record of delivering on commitments build confidence with contractors, installers, and homeowners. A well‑established partner network ensures consistent product availability, service accessibility, and project continuity across markets.
For nationwide deployment programs, pick a partner with a network that can support installation teams, provide rapid parts replacement, and maintain alignment with project timelines.
“A strong partner network is as important as the module itself for turnkey success.” — Hannah Liu, Partner Relations Director
Power your next project with confidence by visiting Portlandia Electric Supply, a nationwide electrical supply distributor and installer partner offering premium Tier 1 solar panels, standby generators, and related electrical equipment. They provide turnkey solar solutions, live support, and fast nationwide delivery from 12+ distribution hubs, serving contractors, installers, and homeowners with 3,800+ in-stock SKUs and a network of 8,500+ solution providers. Click now to unlock faster sourcing, expert guidance, and reliable nationwide delivery—learn more today and power up your success.