2025 H2 Solar Industry Retrospective: Module Pricing Stabilizes, Domestic Manufacturing Surges
This entry is an almanac-style record of the second half of 2025 in the U.S. solar industry: what shipped, what it cost, which factories opened, and which cell technologies gained or lost ground. Figures are drawn from the SEIA/Wood Mackenzie Solar Market Insight series, InfoLink Consulting and PVinsights spot-price trackers, company commissioning announcements, and U.S. government notices published between July and December 2025. Where numbers are estimates or ranges, they are labeled as such. The goal is a factual reference that installers, EPCs, and procurement teams can use when planning 2026 purchasing.
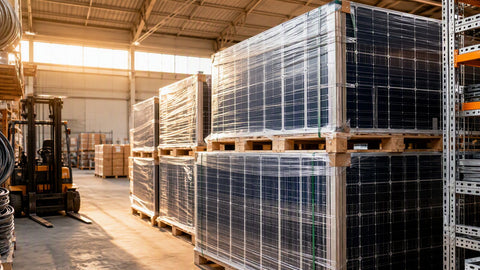
At PES Supply, we tracked these developments in real time because they shaped pricing and availability across our catalog of 50,000+ SKUs from 169 authorized brands. Standard delivery on stocked equipment is 7-10 business days.
Equipment to consider: JA Solar 595W Bifacial Panel or EG4 16kWh WallMount Battery or GoodWe 11.4kW Hybrid Inverter. All available with 7-10 business days delivery from PES Supply's 50,000+ SKUs across 169 authorized brands.
H2 2025 at a Glance: The Headline Numbers
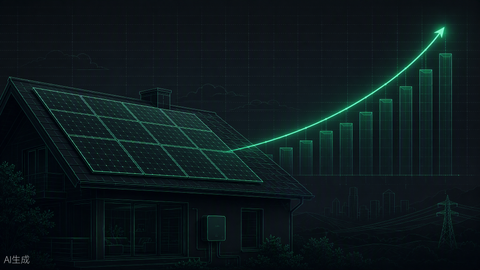
- Full-year 2025 installations: 43.2 GWdc, per the SEIA/Wood Mackenzie Solar Market Insight 2025 Year in Review report — a 14% decline from 2024's record, but still enough for solar to supply 54% of all new U.S. electricity-generating capacity for the fifth consecutive year ([SEIA](https://seia.org/research-resources/solar-market-insight-report-2025-year-in-review/), [pv magazine](https://www.pv-magazine.com/2026/03/12/us-solar-installations-reach-43-gw-in-2025-despite-slowdown/)).
- H2 2025 installations: approximately 24.3 GWdc — 11.7 GW in Q3 (the third-largest quarter on record at the time) and roughly 12.6 GW in Q4 as developers rushed to safe-harbor equipment and meet construction-start deadlines.
- U.S. module nameplate capacity passed 65 GW by the end of 2025, per SEIA's manufacturing tracking, up from about 42 GW at the end of 2024 — a roughly 55% increase in twelve months.
- Domestic cell capacity came online at scale for the first time, with TOPCon cell fabs from ES Foundry, Canadian Solar, Talon PV, Boviet Solar, and Silfab entering production or ramping during the year.
- Module prices stopped falling. Global TOPCon spot prices bottomed near $0.085-0.09/W ex-works China in July and recovered to roughly $0.11/W by December after Beijing's mid-year price-discipline measures; U.S. delivered prices held in a narrow $0.24-0.28/W band through the half.
- TOPCon became the default cell architecture, reaching an estimated 70-75% of global shipments for 2025, while PERC fell below 15% and HJT and back-contact formats shared most of the remainder.
Deployment Record: Quarterly Installations
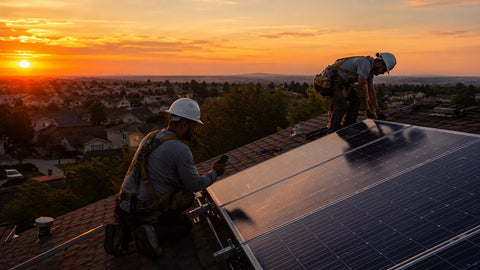
The U.S. market installed approximately 43.2 GWdc across 2025. The second half outpaced the first by roughly 28%, driven by utility-scale completions in Texas, Florida, the Midwest, and the desert Southwest, plus a year-end pull-forward of commercial projects ahead of credit-eligibility deadlines. Residential volume remained soft — high interest rates and the scheduled expiration of the Section 25D homeowner credit after December 31, 2025 weighed on the segment — while community solar posted modest growth on the strength of programs in New York, Illinois, and Minnesota.
Table 1. U.S. solar installations by quarter and segment, 2025 (GWdc, approximate)
| Quarter | Utility-Scale | Commercial | Community | Residential | Total |
|---|---|---|---|---|---|
| Q1 2025 | 6.9 | 0.7 | 0.4 | 1.0 | 9.0 |
| Q2 2025 | 7.7 | 0.7 | 0.5 | 1.0 | 9.9 |
| Q3 2025 | 9.4 | 0.8 | 0.6 | 0.9 | 11.7 |
| Q4 2025 (est.) | 10.1 | 0.8 | 0.7 | 1.0 | 12.6 |
| Full year | 34.1 | 3.0 | 2.2 | 3.9 | 43.2 |
Sources: SEIA/Wood Mackenzie Solar Market Insight quarterly releases; Q4 segment split estimated from interconnection-queue completions and state program reports. Totals may not sum exactly due to rounding.
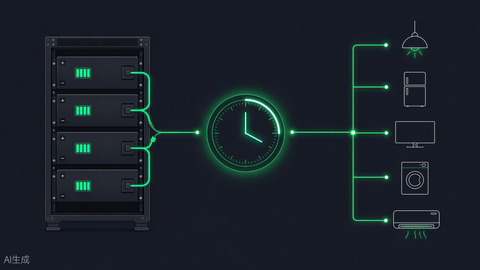
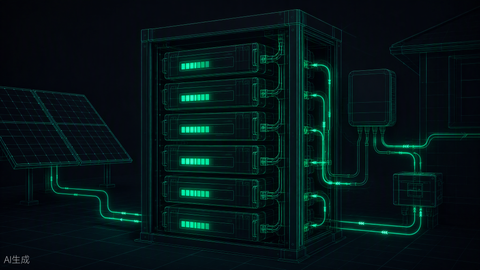
Storage paired with solar continued its climb: the majority of new utility-scale solar in California and Texas interconnected with co-located batteries, and attachment rates on new residential systems in California stayed above 60% under NEM 3.0 economics. For equipment selection on the storage side, see our battery storage collection and the battery sizing guide.
Field note #1 — procurement timing. "I've been sourcing modules for installers for over a decade, and Q4 2025 was the busiest October-to-December I've ever seen. Contractors who had waited for prices to fall another nickel suddenly needed safe-harbor volumes before year-end. The lesson I pass on now: when a tax deadline is on the calendar, lock your modules 90 days early. The crews that did paid the same price as everyone else — they just actually had panels on the dock." — PES Supply sourcing desk
Module Pricing Stabilizes
The defining market event of H2 2025 was the end of the module price collapse. Global spot prices for TOPCon modules had fallen without interruption from early 2023 through mid-2025, bottoming in July at roughly $0.085-0.09/W ex-works China — below cash cost for most manufacturers. In July 2025, Chinese regulators convened the major polysilicon and wafer producers and enforced price floors as part of a broader campaign against below-cost selling; polysilicon futures on the Guangzhou exchange rallied sharply, and wafer and cell quotes followed. By December, TOPCon spot prices had recovered to approximately $0.11/W, and polysilicon had moved from roughly 35 RMB/kg to the vicinity of 50 RMB/kg.
U.S. delivered prices told a calmer story. Because tariffs, freight, and compliance costs dominate the landed cost of imported modules in the U.S., the ex-works recovery translated into a modest firming rather than a spike. Documented U.S. spot ranges through the half were approximately:
Table 2. Module price record, July-December 2025 ($/W)
| Month | TOPCon ex-works China (spot) | Imported mono-facial, U.S. delivered | Imported bifacial, U.S. delivered | U.S.-assembled module |
|---|---|---|---|---|
| July 2025 | 0.085-0.090 | 0.24-0.26 | 0.25-0.27 | 0.30-0.33 |
| August 2025 | 0.088-0.093 | 0.24-0.26 | 0.25-0.28 | 0.30-0.33 |
| September 2025 | 0.094-0.099 | 0.25-0.27 | 0.26-0.28 | 0.31-0.34 |
| October 2025 | 0.098-0.104 | 0.25-0.27 | 0.26-0.29 | 0.31-0.35 |
| November 2025 | 0.102-0.108 | 0.26-0.28 | 0.27-0.29 | 0.32-0.35 |
| December 2025 | 0.105-0.112 | 0.26-0.28 | 0.27-0.30 | 0.32-0.36 |
Sources: InfoLink Consulting and PVinsights weekly spot data for ex-works China; U.S. ranges compiled from distributor quotes and trade-press reporting (pv magazine USA, Utility Dive). U.S.-assembled pricing reflects the Section 45X production credit passed through to varying degrees.
Three structural points from the price record:
- The spread between imported and U.S.-assembled modules narrowed from roughly 9-10 cents in 2024 to about 6-8 cents by December 2025, as new domestic plants ramped and competed for utility-scale commitments.
- Bifacial retained only a 1-2 cent premium over mono-facial, continuing the compression documented in our 2024 retrospective. Bifacial is now the default for ground-mount procurement; see the bifacial solar panel collection for stocked formats.
- Per-watt pricing stopped being the main negotiation variable. With prices in a narrow band, negotiations in H2 shifted to payment terms, delivery windows, domestic-content documentation, and tariff indemnification clauses.
Field note #2 — reading the price tape. "My rule of thumb after twenty years: when ex-works China prices move five cents and my delivered quotes move one cent, the freight-and-tariff stack is doing the talking. That's exactly what happened in the second half of 2025. I stopped telling customers to wait for cheaper panels in September — the floor was in, and everyone in the supply chain knew it." — PES Supply sourcing desk
Domestic Manufacturing Surges
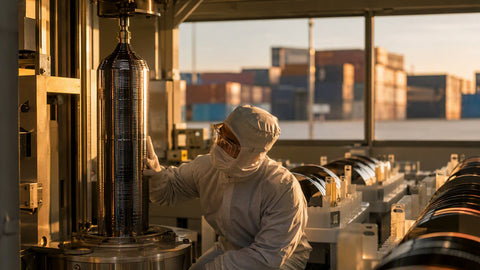
U.S. module assembly nameplate capacity passed 65 GW by the end of 2025, per SEIA's manufacturing tracking — up from roughly 42 GW at the end of 2024 and effectively zero five years earlier. More consequential for the supply chain was the arrival of domestic cell production. Before 2025, nearly every "U.S.-made" module was assembled from imported cells. During 2025, five cell fabs began or continued ramping production, almost all of them TOPCon lines:
Table 3. U.S. cell and module factory record, H2 2025 status
| Manufacturer | Location | Product | Announced capacity | Status at end of 2025 |
|---|---|---|---|---|
| ES Foundry | Greenwood, SC | TOPCon cells | 3 GW | Producing; ramped through 2025 |
| Canadian Solar | Jeffersonville, IN | TOPCon cells | 5 GW | Producing; first output 2025 |
| Talon PV | Houston, TX | TOPCon cells | 4.8 GW | Ramping; commercial output began 2025 |
| Boviet Solar | Greenville, NC | Cells + modules | 2 GW each | First panels 2025; cell fab ramping |
| Silfab Solar | Fort Mill, SC | N-type cells + modules | 1 GW cell / 1.3 GW module | First output H2 2025 |
| First Solar | Iberia Parish, LA | Thin-film (CdTe) modules | 3.5 GW | Commissioned H2 2025 |
| T1 Energy (G1_Dallas) | Wilmer, TX | Modules | 5 GW | Producing; G2_Austin 5 GW cell fab planned |
| Qcells | Cartersville, GA | Ingot/wafer/cell/module | 3.3 GW integrated | Producing; only U.S. ingot/wafer line at scale |
| Illuminate USA (LONGi JV) | Pataskala, OH | Modules | 5 GW | Producing since 2024; full ramp 2025 |
| Waaree Solar Americas | Brookshire, TX | Modules | 3.2 GW | Expansion completed 2025 |
| Runergy USA | Huntsville, AL | Cells + modules | 2 GW | Module line producing; cell line ramping |
| Solar4America | Sumter, SC | Modules | 2.3 GW | Producing |
Sources: company commissioning announcements and trade-press coverage compiled by SEIA and pv magazine USA, July-December 2025. Capacity figures are nameplate, not actual output.
The almanac record must also note what stalled. Several announced projects paused or were canceled during H2 2025 after the July 4 tax law added Foreign Entity of Concern (FEOC) restrictions to the Section 45X production credit, cutting off eligibility for facilities with certain prohibited foreign ownership or control structures. Meyer Burger's earlier U.S. withdrawal stood as a reminder that announced capacity and producing capacity are different numbers. Even after those setbacks, net domestic cell capacity ended 2025 at roughly 10-12 GW ramping — the first meaningful domestic cell base in U.S. history.
One logistical footnote worth recording: the geographic pattern of the buildout concentrated in the Carolinas, Texas, Georgia, and the Gulf Coast, which shortened inland freight legs for projects across the Southeast and Texas but left West Coast delivery times largely unchanged. Gulf Coast module plants also introduced a hurricane-season continuity question that procurement teams began pricing into Q3 delivery contracts for the first time.
For buyers, the practical consequence is choice. Stocked U.S.-made and U.S.-assembled options now span residential and utility formats — for example the Solar4America 550W module, the Silfab Elite 370W n-type TOPCon all-black panel, and the Qcells XL G11.S series — alongside the full USA-made solar panels collection. Brand-level lines for Canadian Solar, JinkoSolar, Boviet, Mission Solar, and Heliene round out the domestic and import mix.
Field note #3 — domestic content paperwork. "The question I fielded most in the back half of 2025 wasn't 'how much per watt' — it was 'can you document domestic content?' My advice: ask for the manufacturer's costed BOM breakdown before you sign, not after. The 10-point domestic-content bonus is worth real money on a 50 MW project, and the audit trail matters. I've seen two projects re-paper their supply agreements in November alone because the documentation was thin." — PES Supply sourcing desk
Technology Share Shifts: TOPCon Takes Over
Cell architecture transition continued at speed. Industry shipment estimates from CPIA and InfoLink Consulting describe the 2025 global mix approximately as follows:
Table 4. Estimated global module shipment share by cell technology, 2023-2025
| Technology | 2023 | 2024 | 2025 (est.) | Direction |
|---|---|---|---|---|
| PERC (p-type) | ~71% | ~25% | ~10% | Retiring; lines converting or idled |
| TOPCon (n-type) | ~23% | ~65% | ~72-75% | Dominant; default for new capacity |
| HJT (n-type) | ~3% | ~4% | ~5-6% | Niche growth; silver-cost pressure |
| Back contact (xBC) | ~3% | ~6% | ~8-9% | Fastest-growing premium segment |
Sources: CPIA annual reports and InfoLink Consulting shipment estimates; 2025 figures are full-year estimates as of December 2025.
Three observations from the technology record:
- The U.S. factory buildout is a TOPCon buildout. Every crystalline-silicon cell fab that entered production in 2025 runs TOPCon, which means the domestic supply base skipped the PERC era entirely. Stocked n-type options live in the n-type solar panels collection; legacy PERC inventory remains available for matching and warranty replacement but is no longer the procurement default.
- HJT held its niche in high-temperature and space-constrained applications, supported by U.S. assembly capacity announced for the format — see the HJT solar panel collection for current availability.
- Module wattage stepped up again. The mainstream 182mm-format utility module moved from the 580-620W band into the 620-660W band during 2025, and 210mm-format residential-adjacent products crossed 700W — browse the 550-709W collection and utility-scale panels for current formats.
The Policy and Tariff Record, July-December 2025
An almanac records dates and provisions without adjudicating them. The H2 2025 policy record, in chronological order:
- July 4, 2025: The One Big Beautiful Bill Act was signed. For solar, it terminated the Section 25D residential credit for expenditures after December 31, 2025; set begin-construction deadlines (within 12 months of enactment, or placed-in-service by end of 2027) for Section 45Y/48E projects; retained the Section 45X manufacturing credit while adding FEOC restrictions; and phased 45X down for wind components while leaving solar components intact through 2029 with gradual reductions thereafter.
- August 2025: Treasury and IRS guidance (Notice 2025-42) clarified the "begin construction" rules for 45Y/48E, tightening the physical-work test and limiting reliance on the 5% safe-harbor for larger projects — a change that pulled Q4 procurement forward, visible in Table 1.
- Antidumping/countervailing duties: Final AD/CVD duties on cells and modules from Vietnam, Malaysia, Thailand, and Cambodia (set in spring 2025, with rates reaching into the hundreds of percent for some producers) were in force throughout the half, and in July 2025 a new petition was filed targeting imports from India, Indonesia, and Laos. Commerce initiated those investigations in August.
- Section 301: The 50% tariff on Chinese polysilicon and wafers that took effect January 1, 2025 remained in place, keeping direct China-linked upstream supply out of the U.S. chain.
- Domestic content bonus: IRS guidance finalized earlier in 2025 kept the 10-percentage-point ITC adder tied to a 40% (rising to 55% for projects beginning construction after 2026) domestic-content cost threshold, which drove the documentation demand described in Field note #3.
For project-level incentive math by state, the solar incentives by state reference and the solar ROI calculator are kept current as guidance evolves.
What the H2 2025 Record Means for 2026 Purchasing
Stripped of commentary, the record supports four planning facts:
- Price risk has shifted from down to sideways-to-up. The July 2025 floor held for five consecutive months. Waiting for a cheaper quote is no longer a strategy with recent evidence behind it.
- Cell origin now matters as much as module origin. With U.S. cell capacity at roughly 10-12 GW against 65+ GW of module assembly, most "assembled in USA" modules still contain imported cells — relevant for both AD/CVD exposure and domestic-content scoring.
- TOPCon supply is abundant; xBC and HJT require earlier booking. Lead times on premium architectures ran 4-6 weeks longer than commodity TOPCon through Q4.
- The post-25D residential market will lean harder on third-party ownership, storage attachment, and state programs. Pairing equipment from the solar inverter collection with the right storage and mounting hardware will matter more to project economics than marginal module price moves.
For the first-half record, see the 2025 H1 retrospective; for the following period, the 2026 H1 recap. The 2023 and 2024 entries complete the series.
Frequently Asked Questions
How much did U.S. solar installations total in 2025?
Approximately 43.2 GWdc for the full year, per the SEIA/Wood Mackenzie Solar Market Insight 2025 Year in Review — a 14% decline from 2024's record, with solar still supplying 54% of all new U.S. generating capacity. The second half contributed roughly 24.3 GW, including 11.7 GW in Q3.
Did solar module prices go up or down in late 2025?
They stabilized and firmed slightly. Global TOPCon spot prices bottomed near $0.085-0.09/W in July 2025 and recovered to roughly $0.11/W by December after Chinese regulators enforced price floors. U.S. delivered prices held a narrow band of roughly $0.24-0.28/W for imported modules and $0.30-0.36/W for U.S.-assembled product through the half.
How much solar manufacturing capacity does the U.S. have after the 2025 buildout?
Module assembly nameplate capacity passed 65 GW by the end of 2025, per SEIA tracking, up from about 42 GW a year earlier. Domestic cell production came online at scale for the first time, with roughly 10-12 GW of TOPCon cell capacity ramping across ES Foundry, Canadian Solar, Talon PV, Boviet, and Silfab, plus Qcells' integrated ingot-to-module line in Georgia.
What share of solar modules are TOPCon now?
An estimated 70-75% of global 2025 shipments, per CPIA and InfoLink Consulting estimates, up from roughly 23% in 2023. PERC fell to about 10%, while HJT held 5-6% and back-contact formats grew to 8-9%. Every crystalline-silicon cell fab that began U.S. production in 2025 runs TOPCon.
What changed in U.S. solar tax policy in the second half of 2025?
The One Big Beautiful Bill Act, signed July 4, 2025, ended the Section 25D residential credit after December 31, 2025, set begin-construction deadlines for Section 45Y/48E, and retained the Section 45X manufacturing credit for solar components with new Foreign Entity of Concern restrictions. IRS Notice 2025-42 in August tightened the begin-construction tests, which pulled Q4 equipment procurement forward.
Is it still worth waiting for module prices to fall before buying in 2026?
The H2 2025 record offers no support for that strategy: the July price floor held for five consecutive months, the import/domestic spread narrowed, and negotiations shifted to terms, delivery windows, and documentation rather than per-watt price. Procurement risk in 2026 is concentrated in lead times and cell-origin documentation, not in catching a lower price.